

Welcome to the step-by-step SiteProfiler guide. The tool is the latest addition to the Mangools SEO tools package.
SiteProfiler is a website analysis tool bringing all important SEO metrics and website insights on one screen.
In fact, the tool is so easy to use that this guide could be only one sentence:
Enter the root domain or URL and click on the “Analyze website”.
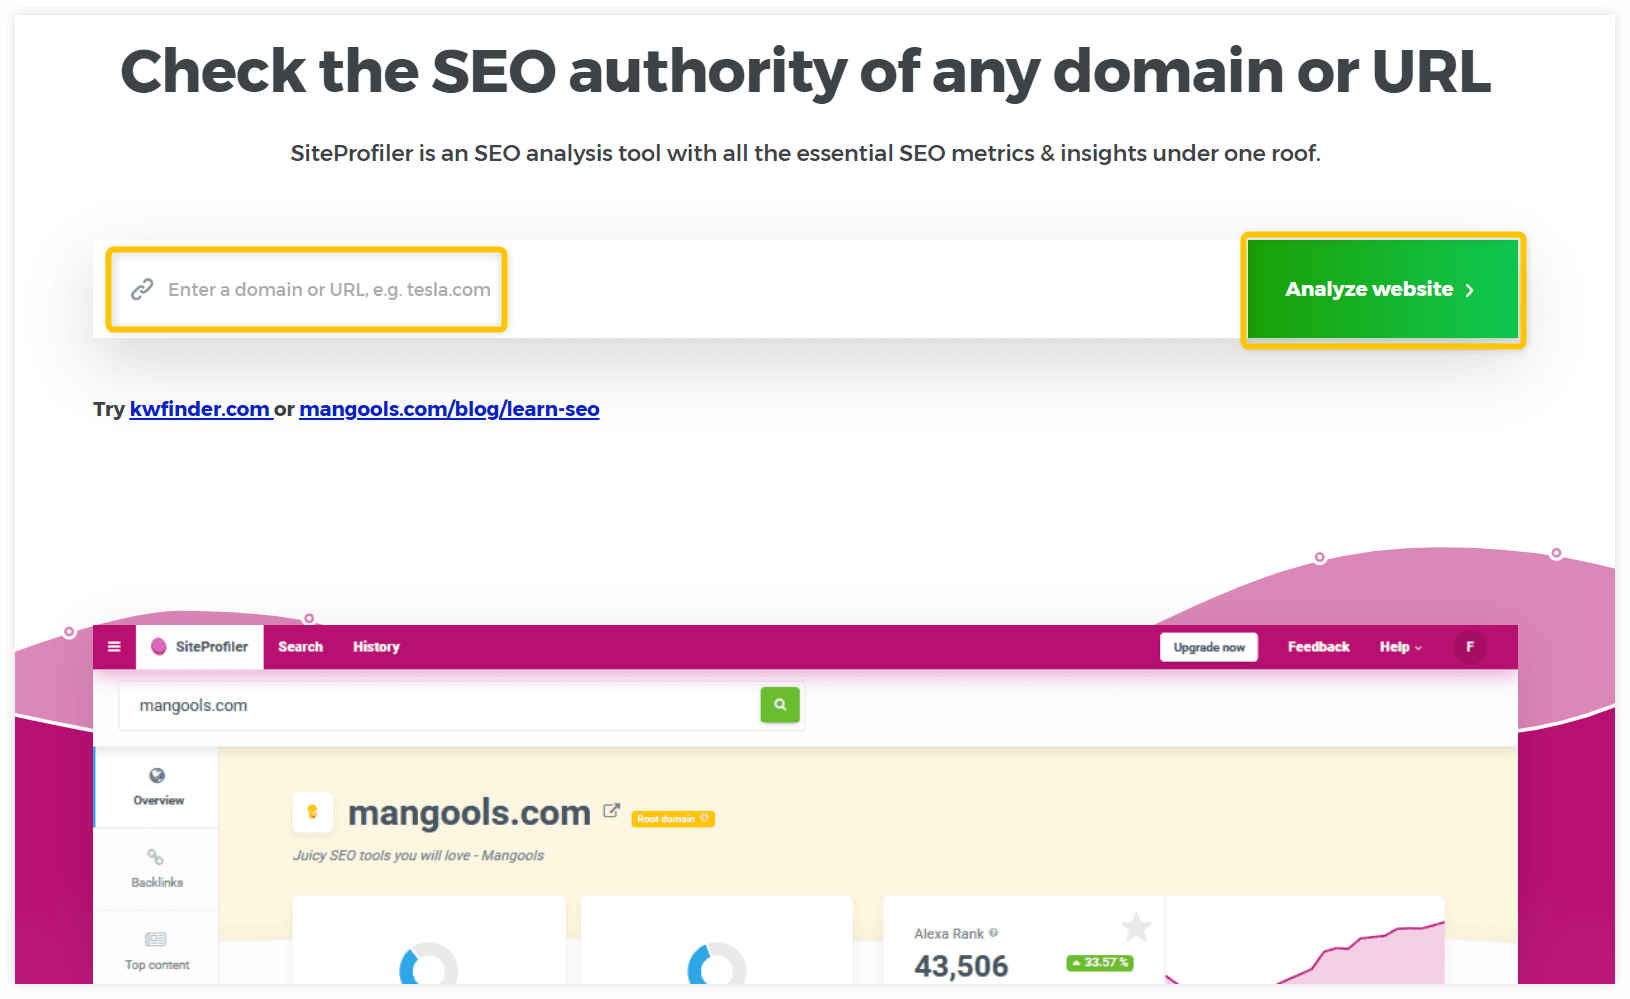
Screenshot 1: SiteProfiler landing page
Quick tip:
We recommend using the root domain as your input because most of the metrics and data are domain-based.
You will see the following data:
- Overview
- Backlinks
- Top content
- Competitors
You can switch between the sections by scrolling or clicking on any of them in the left navigation panel.
Quick tip:
We have included short definitions and explanations of the metrics and charts used in the tool. Just hover your mouse over the exclamation or info symbol to see it.
1. Overview
The overview section evaluates the domain authority and popularity by using the well-known SEO metrics by Moz, Majestic and the popularity metrics such as Alexa and Facebook.
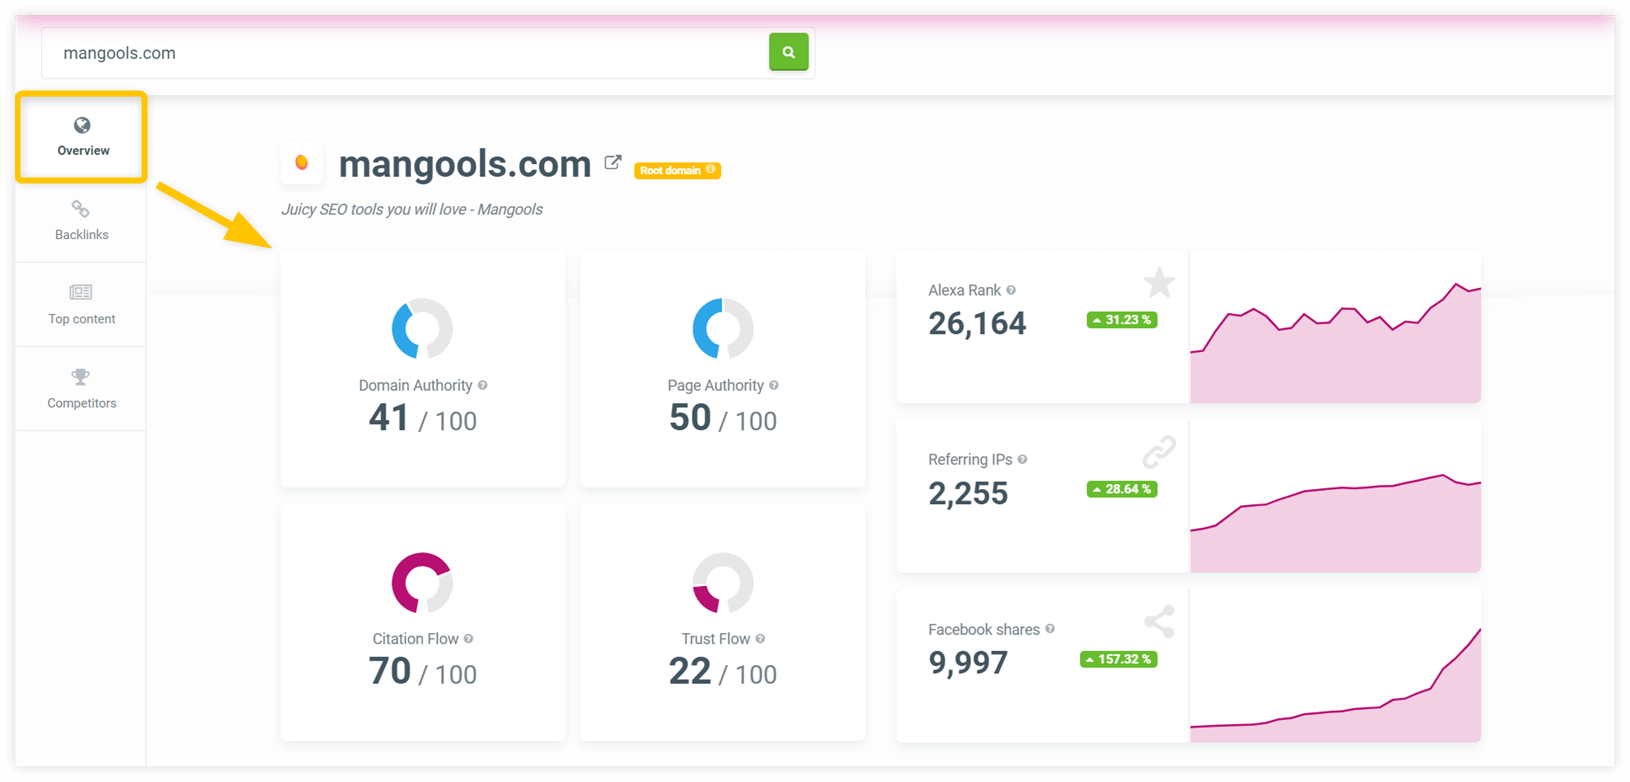
Screenshot 2: Overview of the SEO metrics
As you can see in the screenshot, SiteProfiler displays the following metrics:
Domain Authority – a metric developed by Moz that predicts how well the domain will rank in the SERP compared to others. Scale: 0 – 100.
Page Authority – another metric by Moz that predicts how well the specific page will rank in the SERP compared to others. Scale: 0 – 100.
Understand them both as relative metrics mostly based on backlinks.
Citation Flow – predicts how influential is the URL based on the quantity of backlinks. This metric is developed by Majestic. Scale: 0 – 100.
Trust Flow – predicts how influential is the URL based on the quality of backlinks. It’s developed by Majestic and indicates that backlinks from trustworthy websites will increase the Trust Flow while backlinks from questionable websites will lower the score. Scale: 0 – 100.
Alexa Rank – approximates the domain popularity compared to others based on the number of unique visitors and page views. The lower is the number, the more popular is the domain. That’s why the chart is reversed.
Referring IPs – is the number of referring IP addresses based on the Majestic backlink index. This metric is more precise than the number of backlinks, but keep in mind that many domains (websites) can be hosted on the same IP address.
Facebook shares – is the number of Facebook shares of the analyzed domain (URL).
The charts of the “Alexa Rank”, “Referring IPs” and “Facebook shares” display the data from the last 6 months.
2. Backlinks
This section includes a lot useful of information to identify the backlink profile, its health or spam potential.
Total, new and deleted backlinks
The interactive chart represents the trend of the total number of backlinks in the last 4 months with daily data. Move your cursor over the chart area to see the number of backlinks on different days.
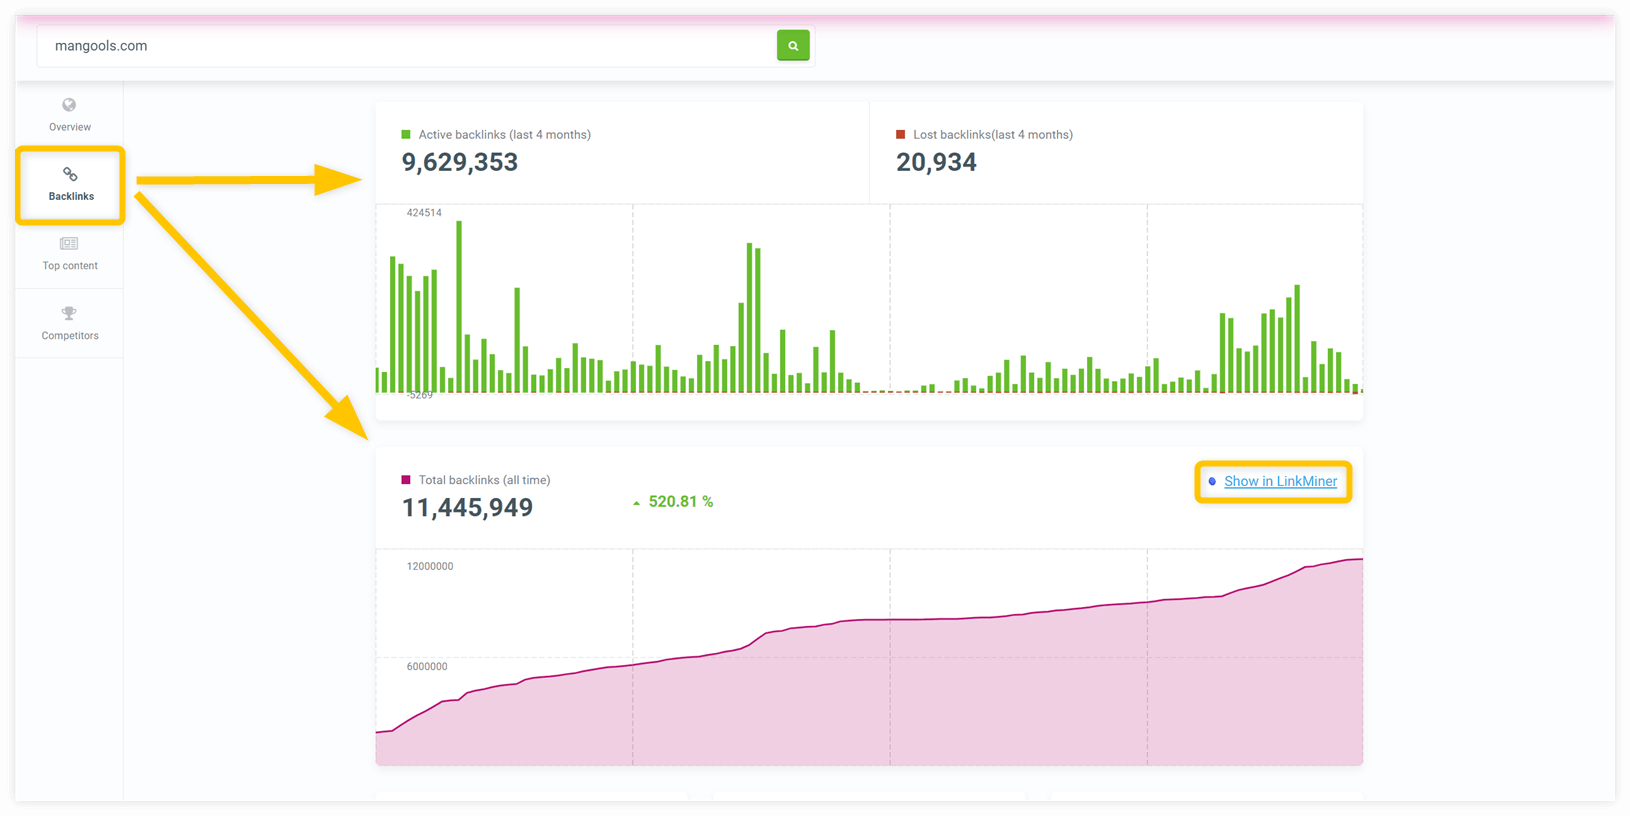
Screenshot 3: Total, new and deleted backlink charts
Right below is the number of new and deleted backlinks grouped together in another interactive chart. These numbers are also based on the last 4 months and you can see the daily comparison of new vs. deleted backlinks by moving the cursor.
Quick tip:
Click on one of the 3 buttons “Show backlinks” to see the backlinks and their detailed analytics in LinkMiner.
Backlink types and ratios
Besides the link type distribution, there are pie charts with the following ratios for deeper insights:
- Dofollow links ratio (Dofollow vs. Nofollow links)
- Active links ratio (Active vs. Deleted links)
The number of “Referring domains”, “Referring IPs” and “Referring subnets” with the number of average links per each will give you detailed information of how many backlinks the website really has.
The “Referring subnets” metric is the most precise as there can be many websites hosted on the same IP address.
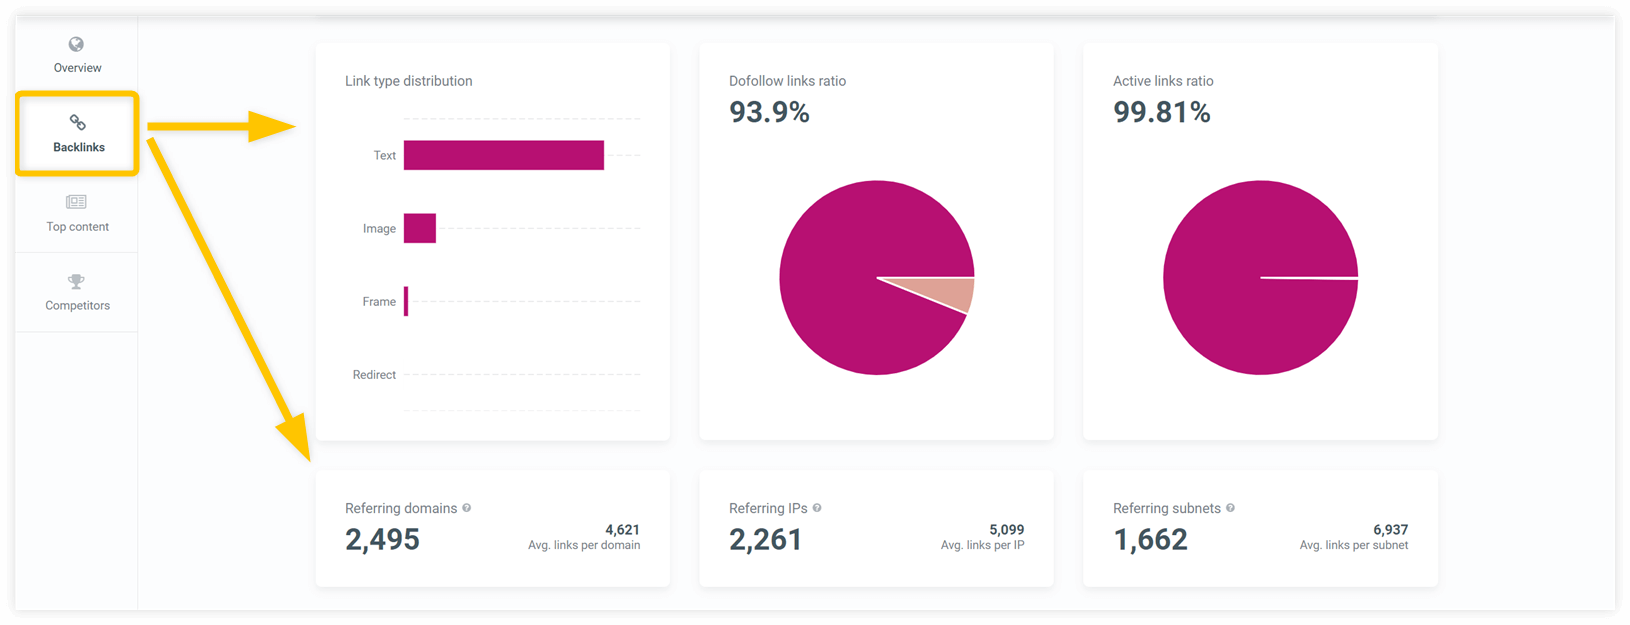
Screenshot 4: Backlinks distribution
Top referring domains and anchor texts
The list of the “Top referring domains” comes with the following metrics:
- CF – Citation Flow
- TF – Trust Flow
- Link – Total number of backlinks
- Alexa Rank
The pie chart shows the Alexa Rank distribution of the referring domains. It’s an indicator of a healthy/unhealthy link profile.
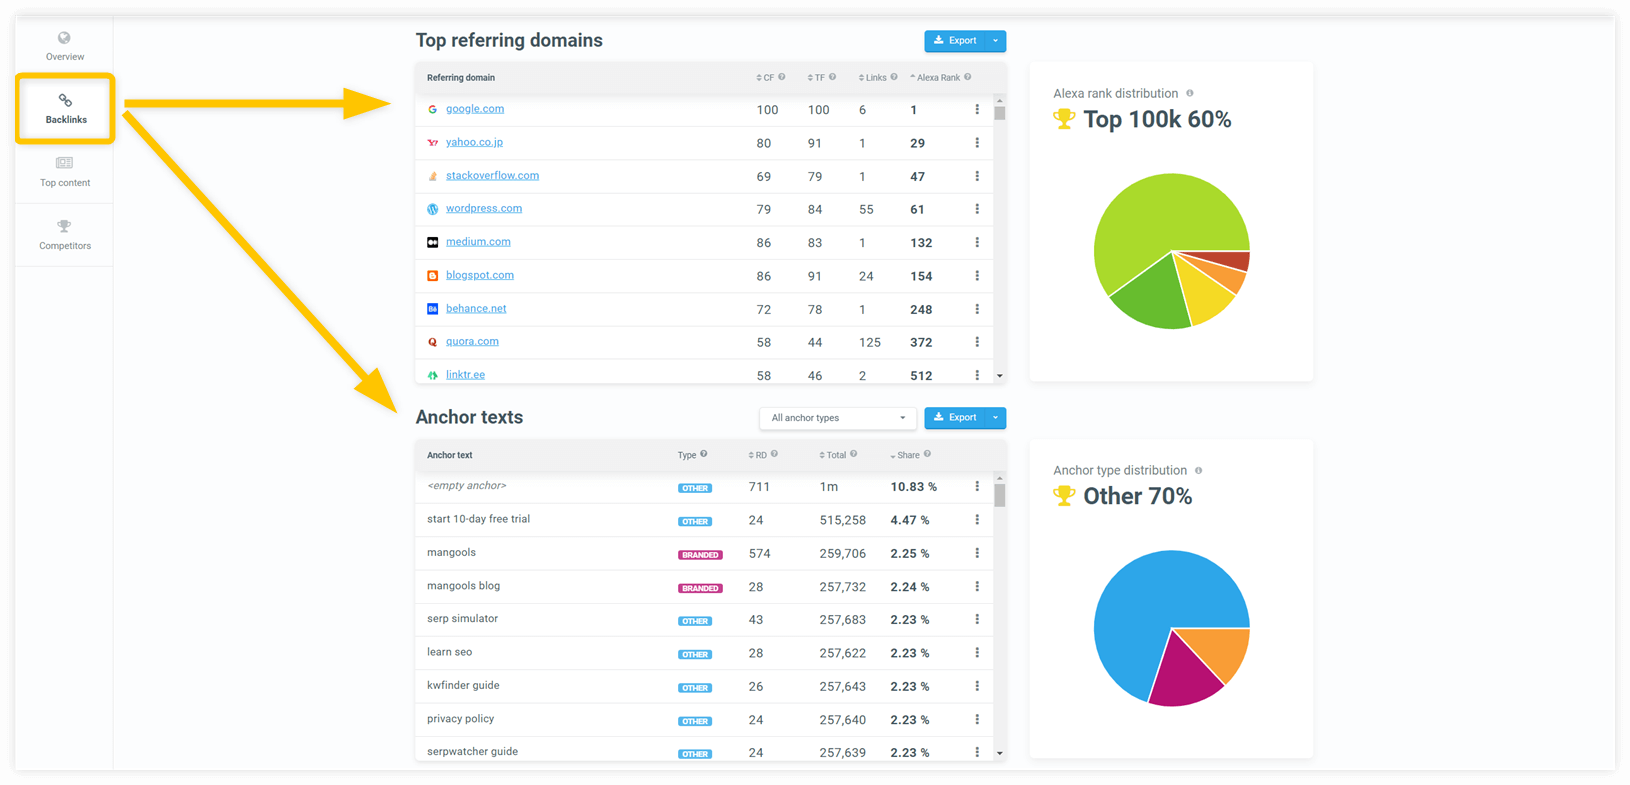
Screenshot 5: Top referring domains and anchor texts
When it comes to the “Anchor texts”, there are the top 100 anchors. Feel free to select from:
- All anchor types
- Branded
- Naked
- Other
Sort the results by:
- RD – The number of referring domains
- Total – The total number of the particular anchor text
- Share – The percentage share of the particular anchor text
The pie chart gives you a quick overview of the anchor text type distribution.
Quick tip:
Open all referring domains in LinkMiner by clicking on the “Show backlinks” and export both the referring domains and anchor texts by clicking on the “Export”.
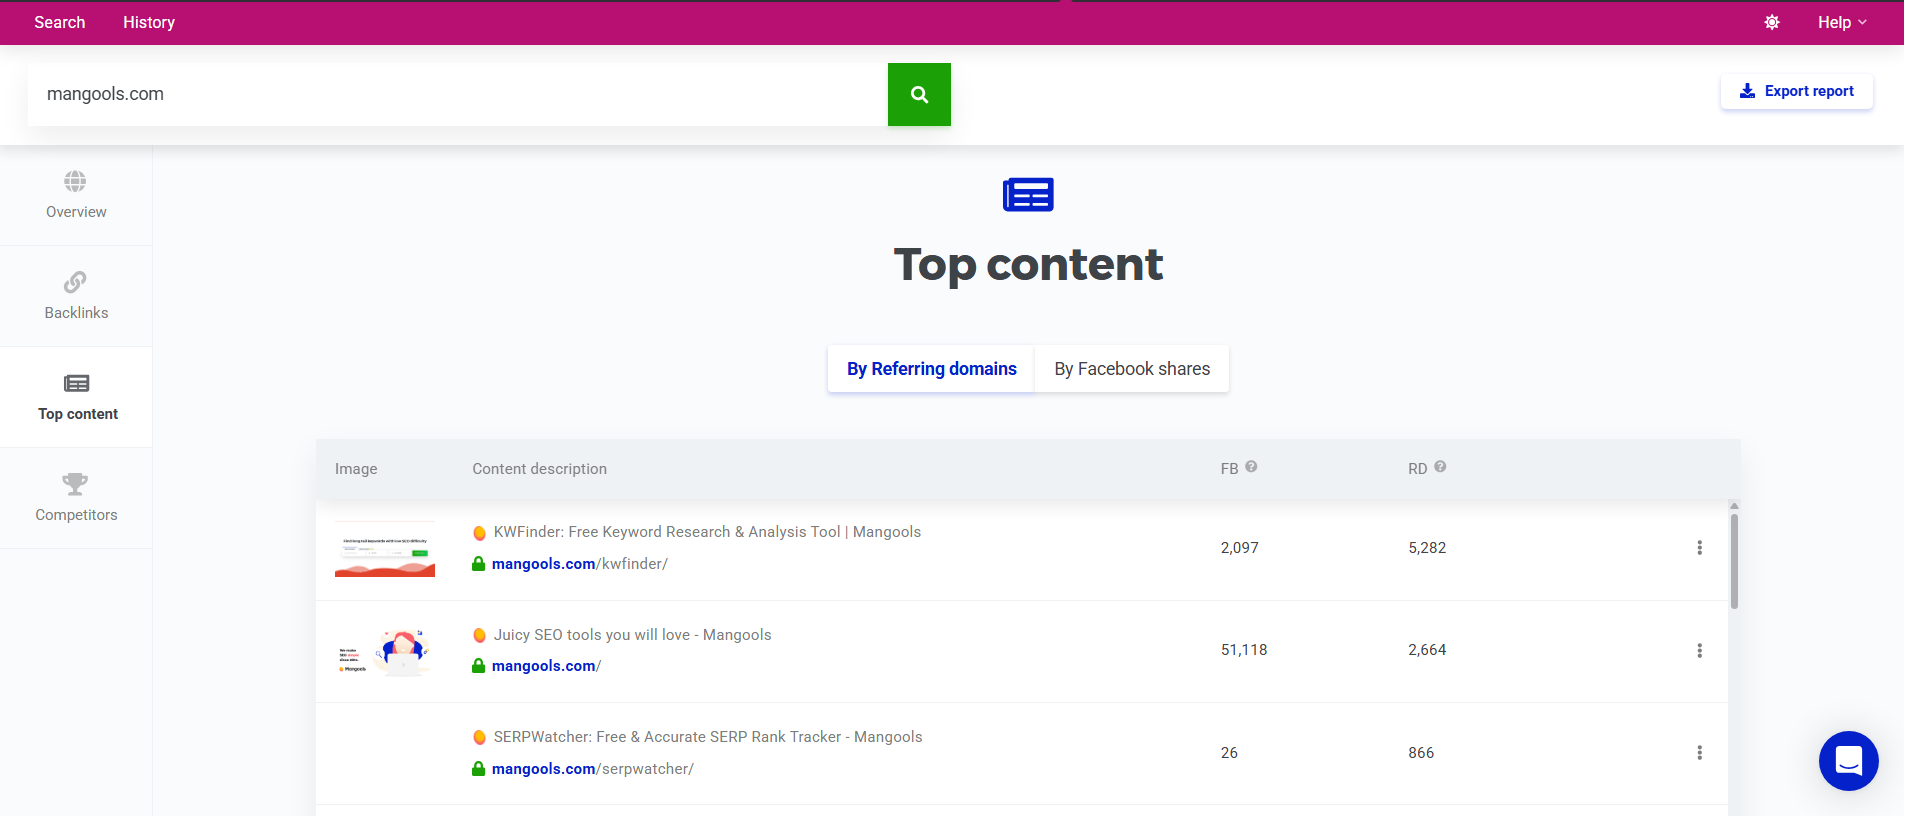
3. Top content
The “Top content” shows the best URLs of the analyzed domain in terms of the Facebook shares and referring domains. Sort the results depending on your preferences.
4. Competitors
The last section is a brief competitor analysis. The algorithm finds potential competitors or similar websites.
You can compare the analyzed website with the results by using the following metrics:
- Alexa Rank
- Referring IPs
- Facebook shares
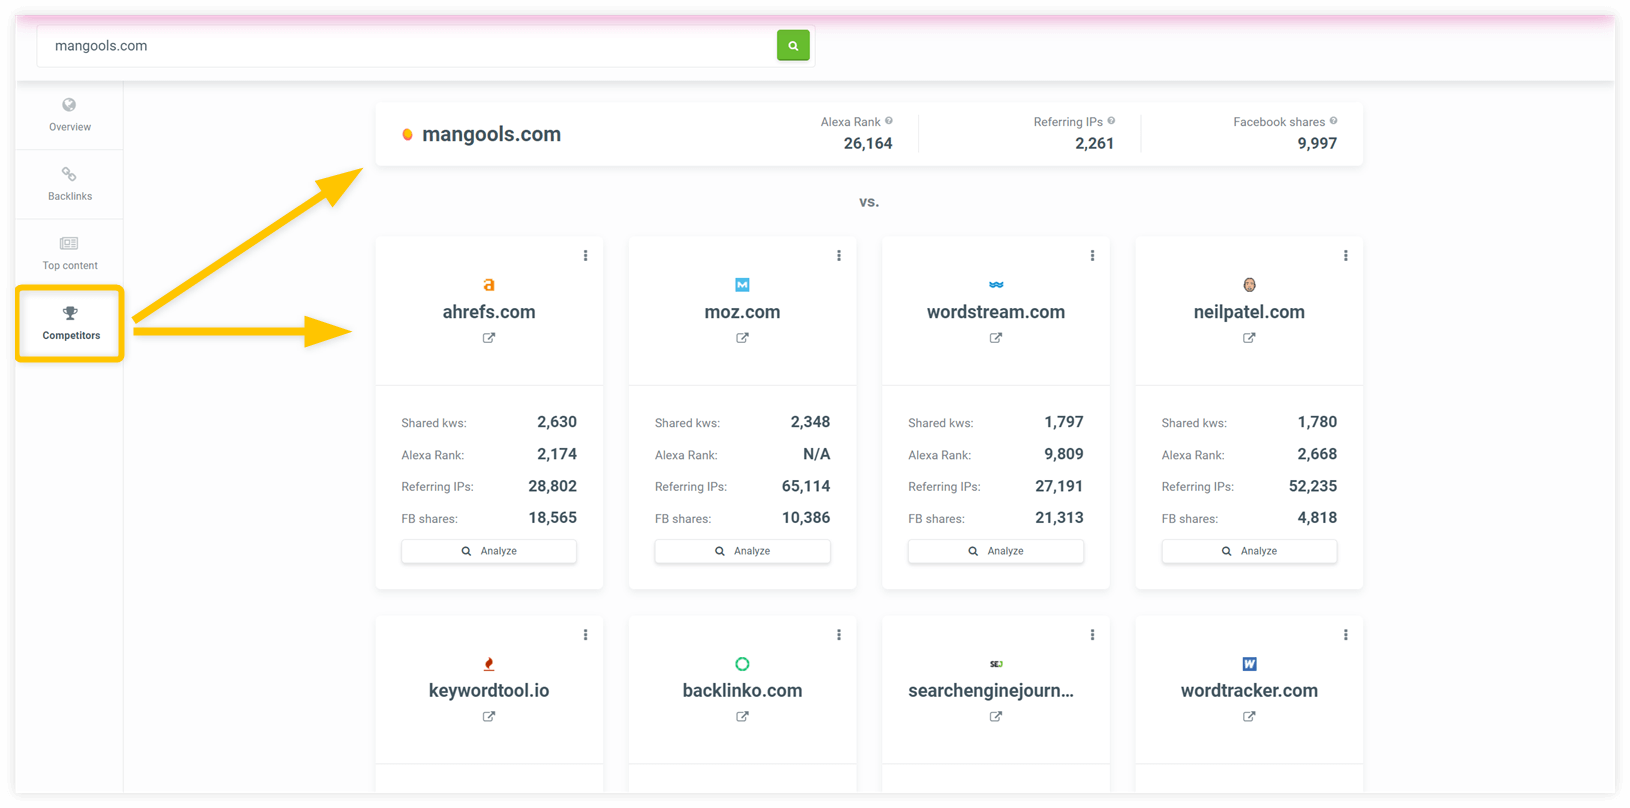
Screenshot 6: Competitors and similar websites
Quick tip:
If you want to analyze the competitors, just click on the “Analyze” in the block(s).
Didn’t find what you were looking for?
If you have any questions or tips what to include in the SiteProfiler guide, feel free to share them in the comments.
In case you have troubles using SiteProfiler, don’t hesitate to contact us via live chat or email.