
TL;DR;
We just released a new version of Mangools SERPWatcher in which we have improved the parsing of search engine result pages (SERP), resulting in more accurate data and new super visual metrics.
Note:
- Slight changes in the positions of your tracked keywords may occur in the new version, but don’t worry – this is a result of data refinement.
- The first new visual metrics will be available in your tracking after 28 April 2023.
SERP is constantly changing and Mangools is changing with it
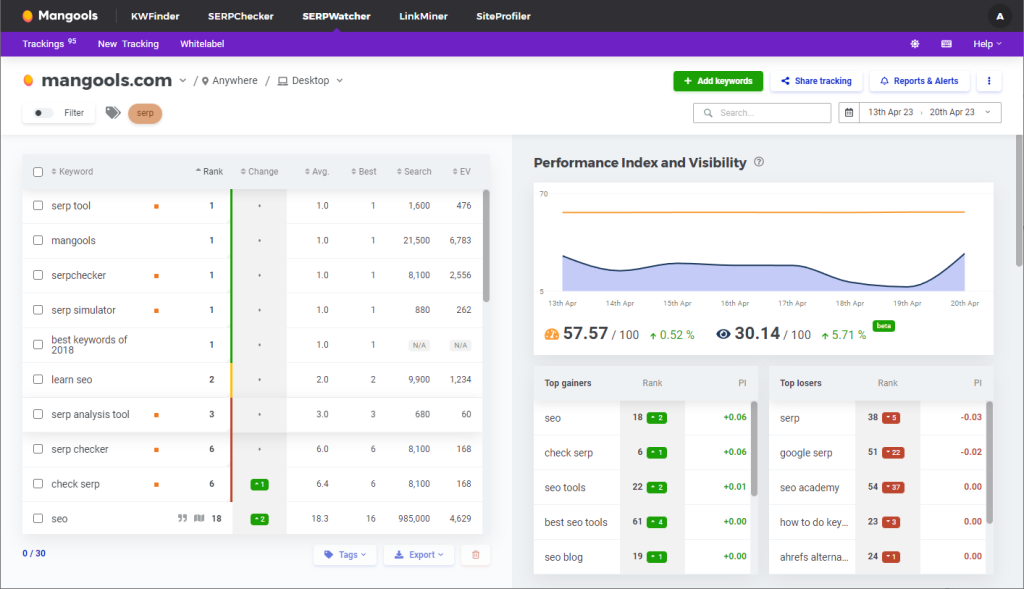
Our rank tracker, SERPWatcher, works on a clear principle – it analyzes the search engine result pages (SERP) for specific domains and keywords, and displays the position, search volume, and other metrics for each keyword. In the report, you can then see at which position your specified keywords have been ranked, which is useful information to evaluate the performance of your SEO.
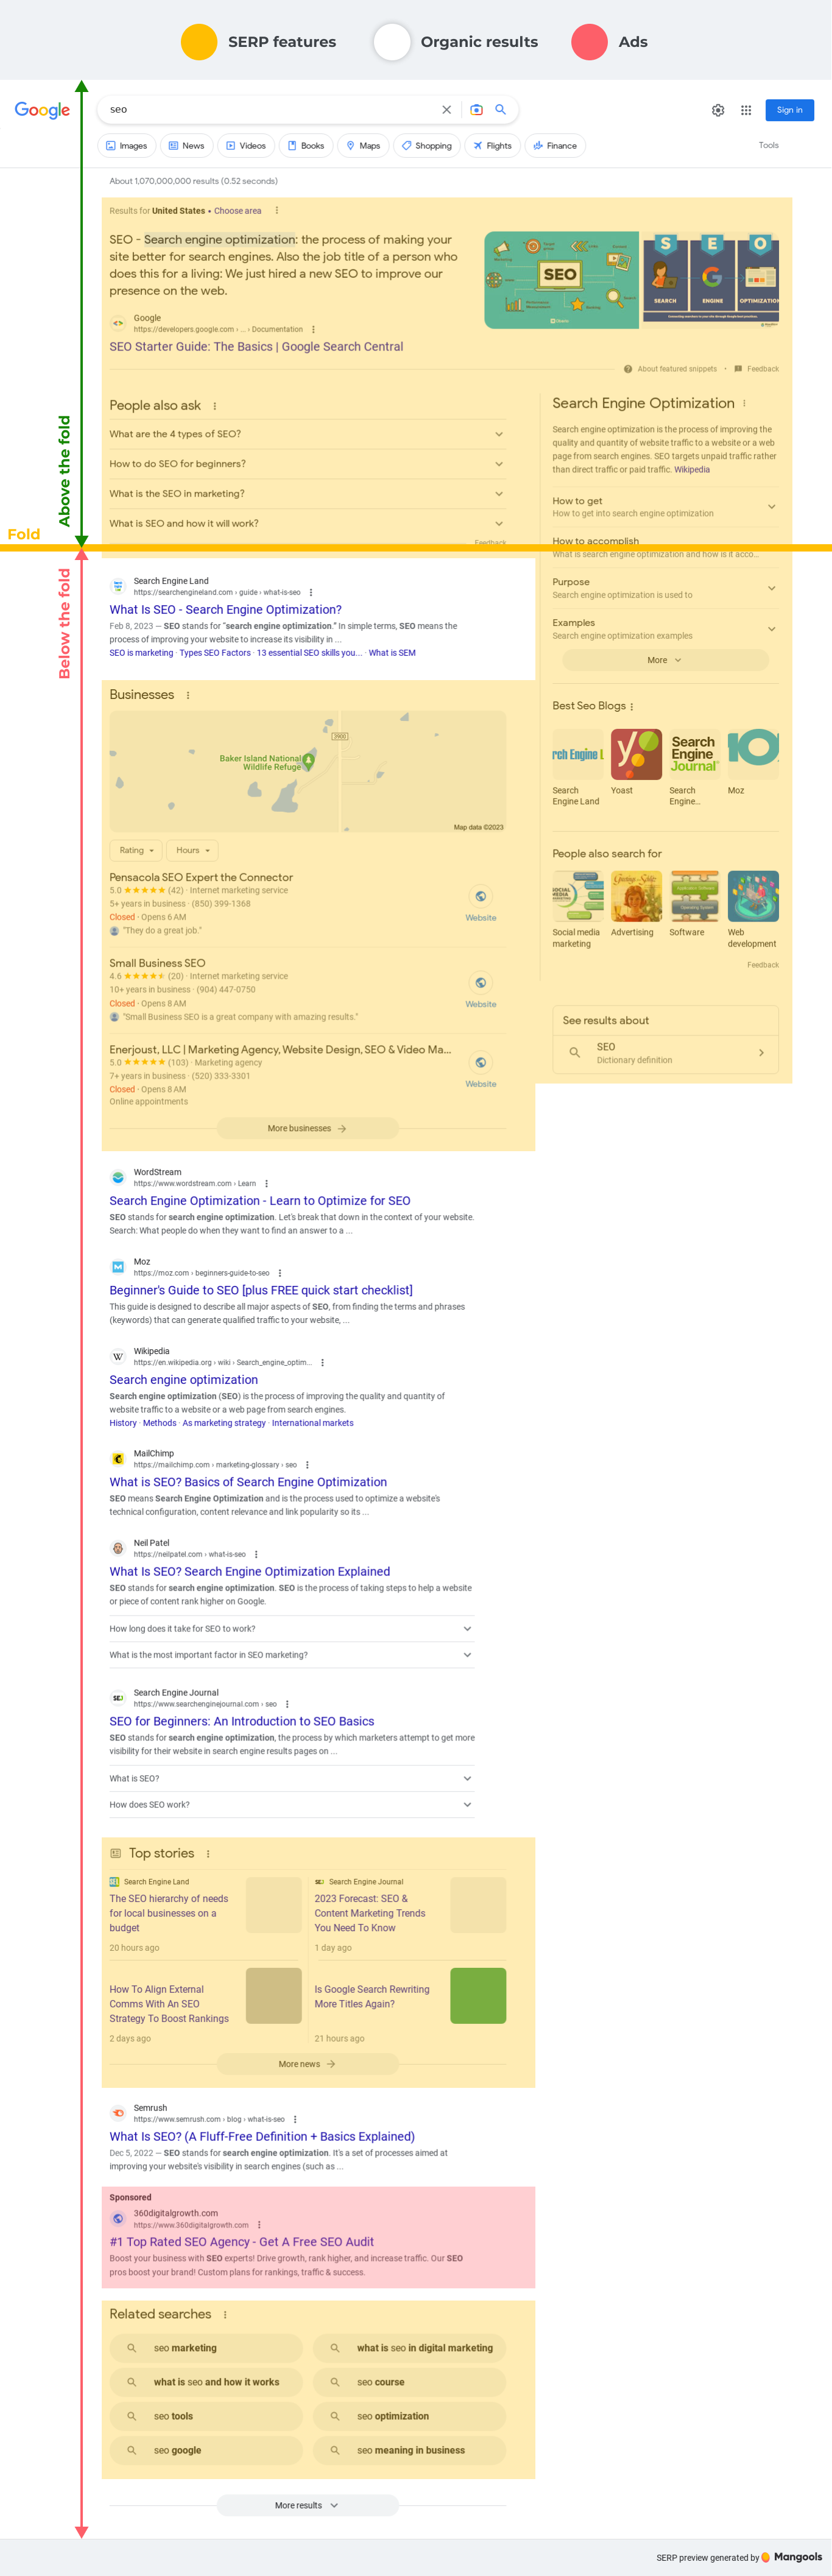
However, knowing your keyword rankings is not enough to determine where a real user will find your record in the SERP. You may rank first but your record could still be buried deep below the fold. And the position relative to the fold significantly affects click-through rate.
Today’s SERP is not just about a few ads and organic results. Images, videos, feature snippets, map packs, people also ask… SERP abounds with dozens of different features that are usually displayed above organic results.
Looking at SERP from a user’s perspective
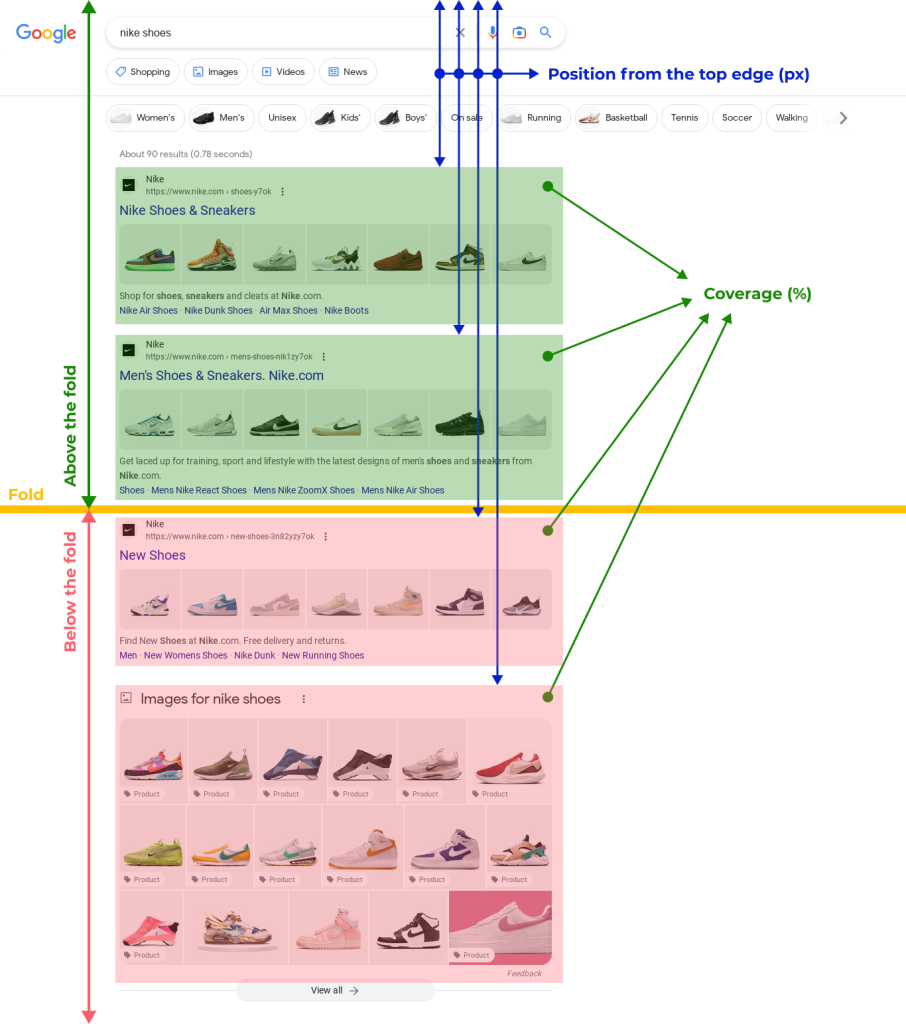
We want to provide you with a comprehensive picture of how your keywords are performing. To do this, we have expanded SERPWatcher with visual metrics. You can now track not only the position, but also how many pixels from the top edge of the SERP a record is located and how much space it takes up in SERP.
The best part is that you can also track changes over time. This way, you’re able to see how position, location, and coverage are changing. I guess that might have confused you a little, right? Keep reading, and the next paragraph will solve any mysteries 😉
New metrics bring new opportunities
What are the new metrics and what are they good for?
- Position to the fold – Have you always wanted to quickly see whether a record is above, at, or below the fold? Well, here it is! 😎
Fold: We have set the fold position in Mangools as a constant that reflects the average height of the most commonly used desktop and mobile displays. The constant may change over time; for desktop displays, it is currently set to 768 pixels. - Position from the top of the browser – We simply display how many pixels the record is from the top of the browser window. The lower the value, the better.
- Coverage – Not all organic records in SERP are the same size. For example, a record with search intent or a map pack takes up much more space. This metric is shown in the keyword detail and expresses in percentage the area that a record occupies in SERP. The more, the better.
- Visibility index – This is our unique metric that calculates visibility index based on position and coverage using a super-secret formula 😜. In short, the closer to the top and larger the record is, the better and the higher the index will be. When developing this formula, we used not only data from our parser, but also Google Organic Click Through Rate (CTR) data. The Visibility Index simply shows whether and how much a domain is visible in SERP for a tracked keyword.
Let’s take a closer look at the new metrics
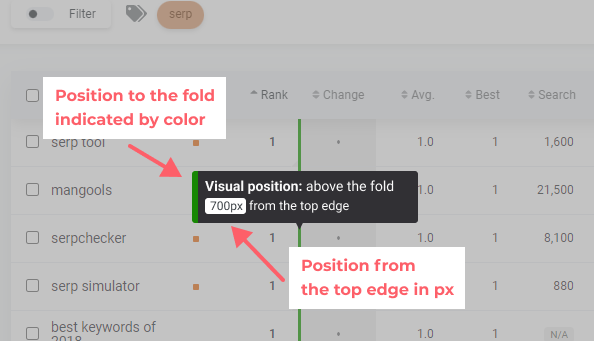
Position to the fold
The first thing that catches your eye when you open our rank tracker is the new column in the left table. It’s hard to miss because it doesn’t contain numbers, but a colorful stripe indicator instead. How else to express visual metrics than visually, right? 😃
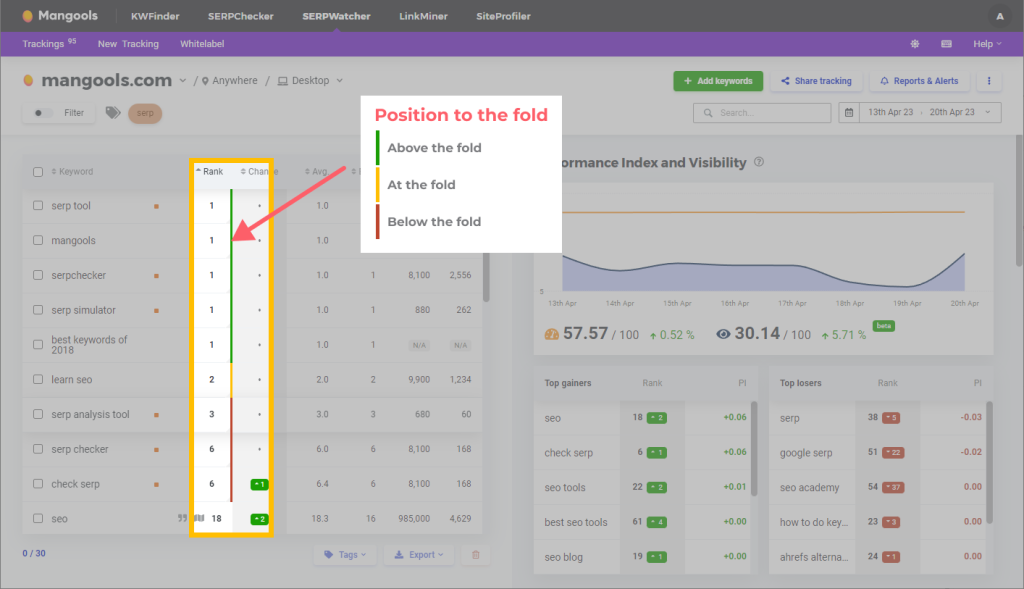
So, how to understand these new colored stripes? Quite simply! They express three possible states of records on the SERP:
- Above the fold: green
- At the fold: orange
- Below the fold: red
At first glance, you can see in which part of the page the record is located. But that’s not all – try hovering over the stripe with your mouse! In the tooltip, we will show you exactly how many pixels the record is from the top of the browser window.
Note: You may notice that we intentionally display the colored position indication relative to the fold for records ranked up to the tenth position. This is because our parser processes and evaluates SERPs with 100 results on one page, without pagination. Anything at the 10th position or higher is therefore considered below the fold and we could mark such a record as red. However, SERPs are usually displayed with pagination, with about 10 organic records per page. All records ranked at 11th position or higher are therefore realistically on the second or subsequent pages of the SERP, and SERPWatcher can no longer determine their visual position. But take a look at SERPChecker – it processes SERPs with pagination, so you can check their visual position there.
Visibility index
Our Performance Index metric has been around for some time and shows performance based on rankings and search volumes. Now, we’re adding an entirely new metric called Visibility Index, which sheds new light on evaluating the performance of the results in the SERP.
The “Visibility Index” immediately reveals whether the results on the SERP are actually in plain sight!
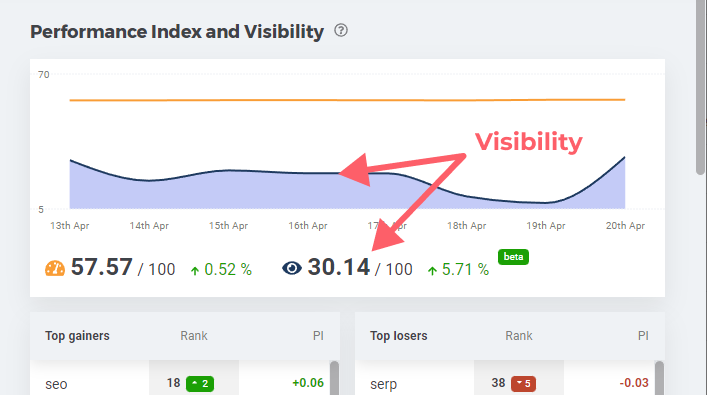
The index is based on visual metrics and its main task is to indicate how a domain is doing over time in terms of visual metrics.
The calculation of the index is based on the position and area of records on the SERP. The goal is to have an index value as high as possible. However, to achieve 100%, you would have to occupy all the records above the fold for the specified keywords in the SERP. This is an ambitious goal, but not unattainable! Take a look at the SERP for the keyword “nike shoes,” for example. The domain nike.com clearly dominates there and therefore deserves a high Visibility Index from us.
Keyword details
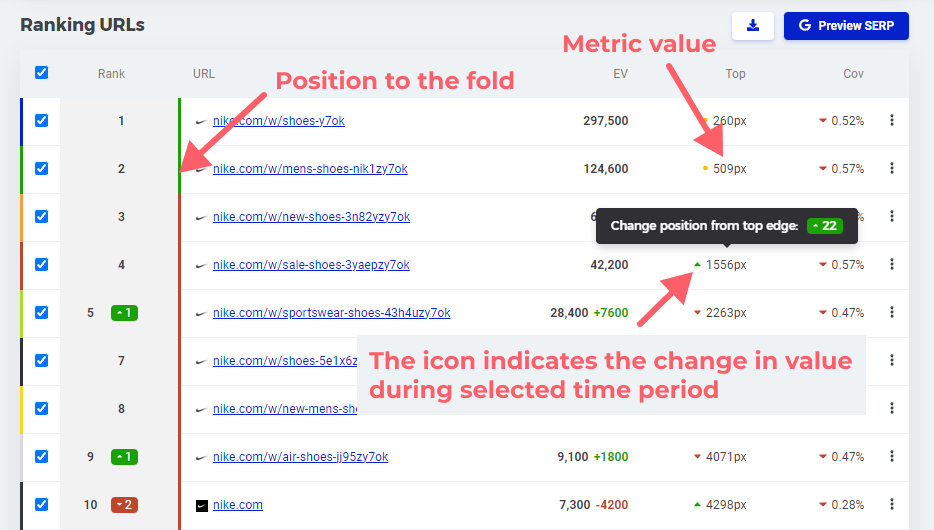
When you look at the details of a keyword, you will find the same way of indicating position relative to the fold in the table, and, in addition, detailed values of metrics. Here you will find the position of records relative to the top edge of the window and also the coverage. An icon is displayed before each metric value, indicating whether the metric has improved or not over the specified time period:
- Improvement: green arrow up
- No change: orange dot
- Worsening: red arrow down
Multiple URLs and features
What if you rank for multiple URLs or features with a given keyword? No problem – in the keyword detail, you will find values for individual metrics broken down for individual records. As for the main table with a list of keywords, the situation is as follows:
- Position to the fold and Position from top of browser: we display an indication and value of the highest-ranked record.
Did we make you happy?
These are some changes, right? 😎 What do you think, do you find the visual metrics useful? Feel free to share your feedback with us, we’d love to hear what you think!
Thank you for being with us. 🧡
P. S.: Follow our blog and subscribe to our newsletter to stay-up-to date with important news. Oh, and you can add your suggestions for improvement to our suggestion board.
