

What is Google Analytics?
Google Analytics is a website analytics tool developed by Google. It enables you to track the traffic and user behavior on your website. Google Analytics offers hundreds of reports in form of tables and visual charts based on both historical and real-time data.
The tool was launched in 2005. Nowadays, it’s part of the Google Marketing Platform that offers tools like Data Studio, Optimize, Tag Manager and others. Analytics basically covers all needs of website analytics.
Is Google Analytics free?
Yes, the standard version is available for everyone for free. There are two versions of the tool:
- Standard Analytics (free)
- Analytics 360 (paid)
Unless you are a huge corporation, the standard Analytics is the right fit for you. It’s completely free of charge and offers all the features.
The Analytics 360 starts at $150,000 per year and offers advanced versions of all features plus advanced advertising solutions.

Top 12 reasons why you should use Google Analytics
As a marketer, SEO specialist or business owner, the consistent usage of the Google Analytics is one of the key processes you should cover in order to understand your customers and boost your business results.
Analytics data only drives business value when it connects to operational systems. “Ecommerce businesses tracking conversions in Google Analytics but managing inventory, orders, and financials in separate systems create dangerous blind spots,” notes Gabriel Cohen from business management platform Klipboard.com.
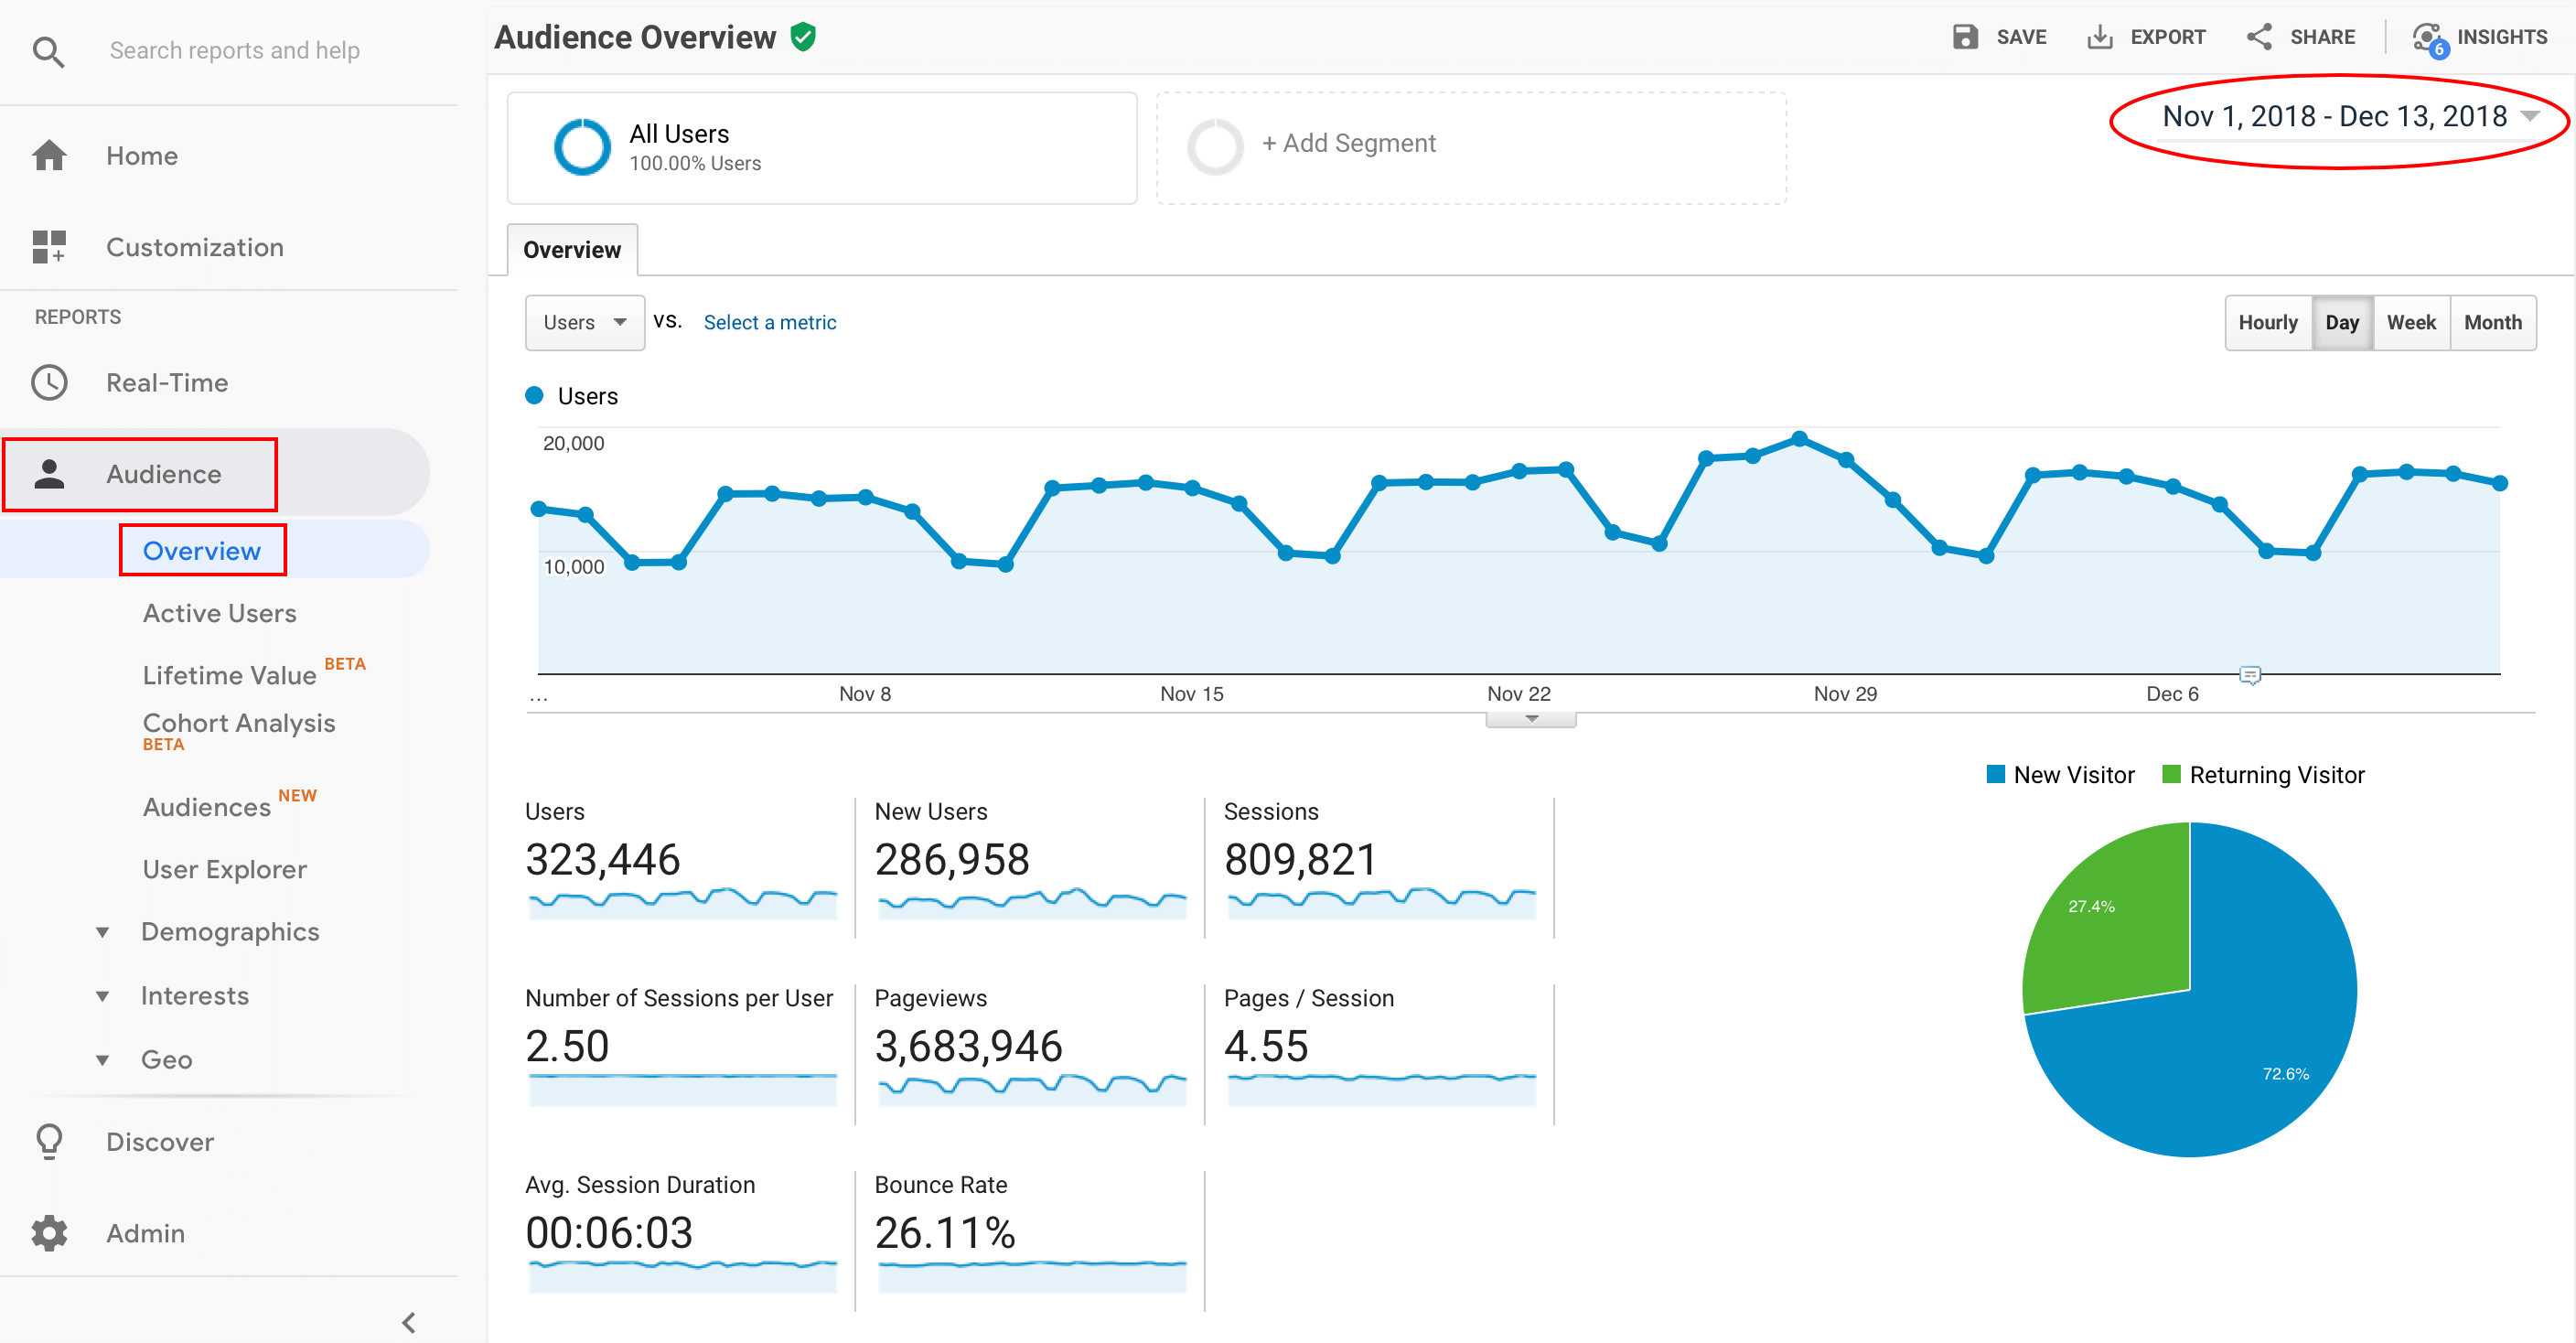
1. Website traffic
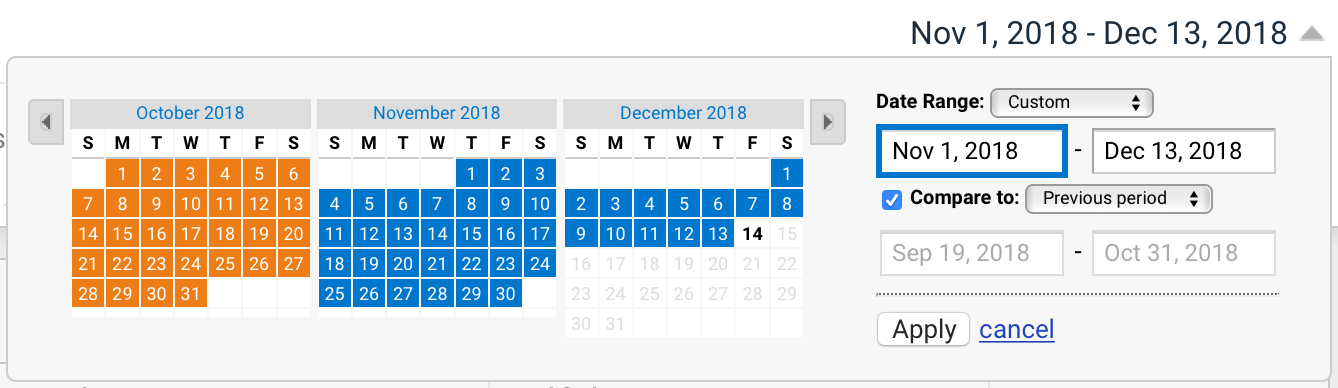
Google Analytics tracks all traffic that your website gets. Having clear statistics of the traffic progress is the first step to evaluate how well your website performs.
The tool offers many views depending on the way you would like to analyze the data. The basic overview can be found under the “Audience” tab. All the data in Google Analytics is based on the selected time frame. You can select from one of many presets or set your own time period.
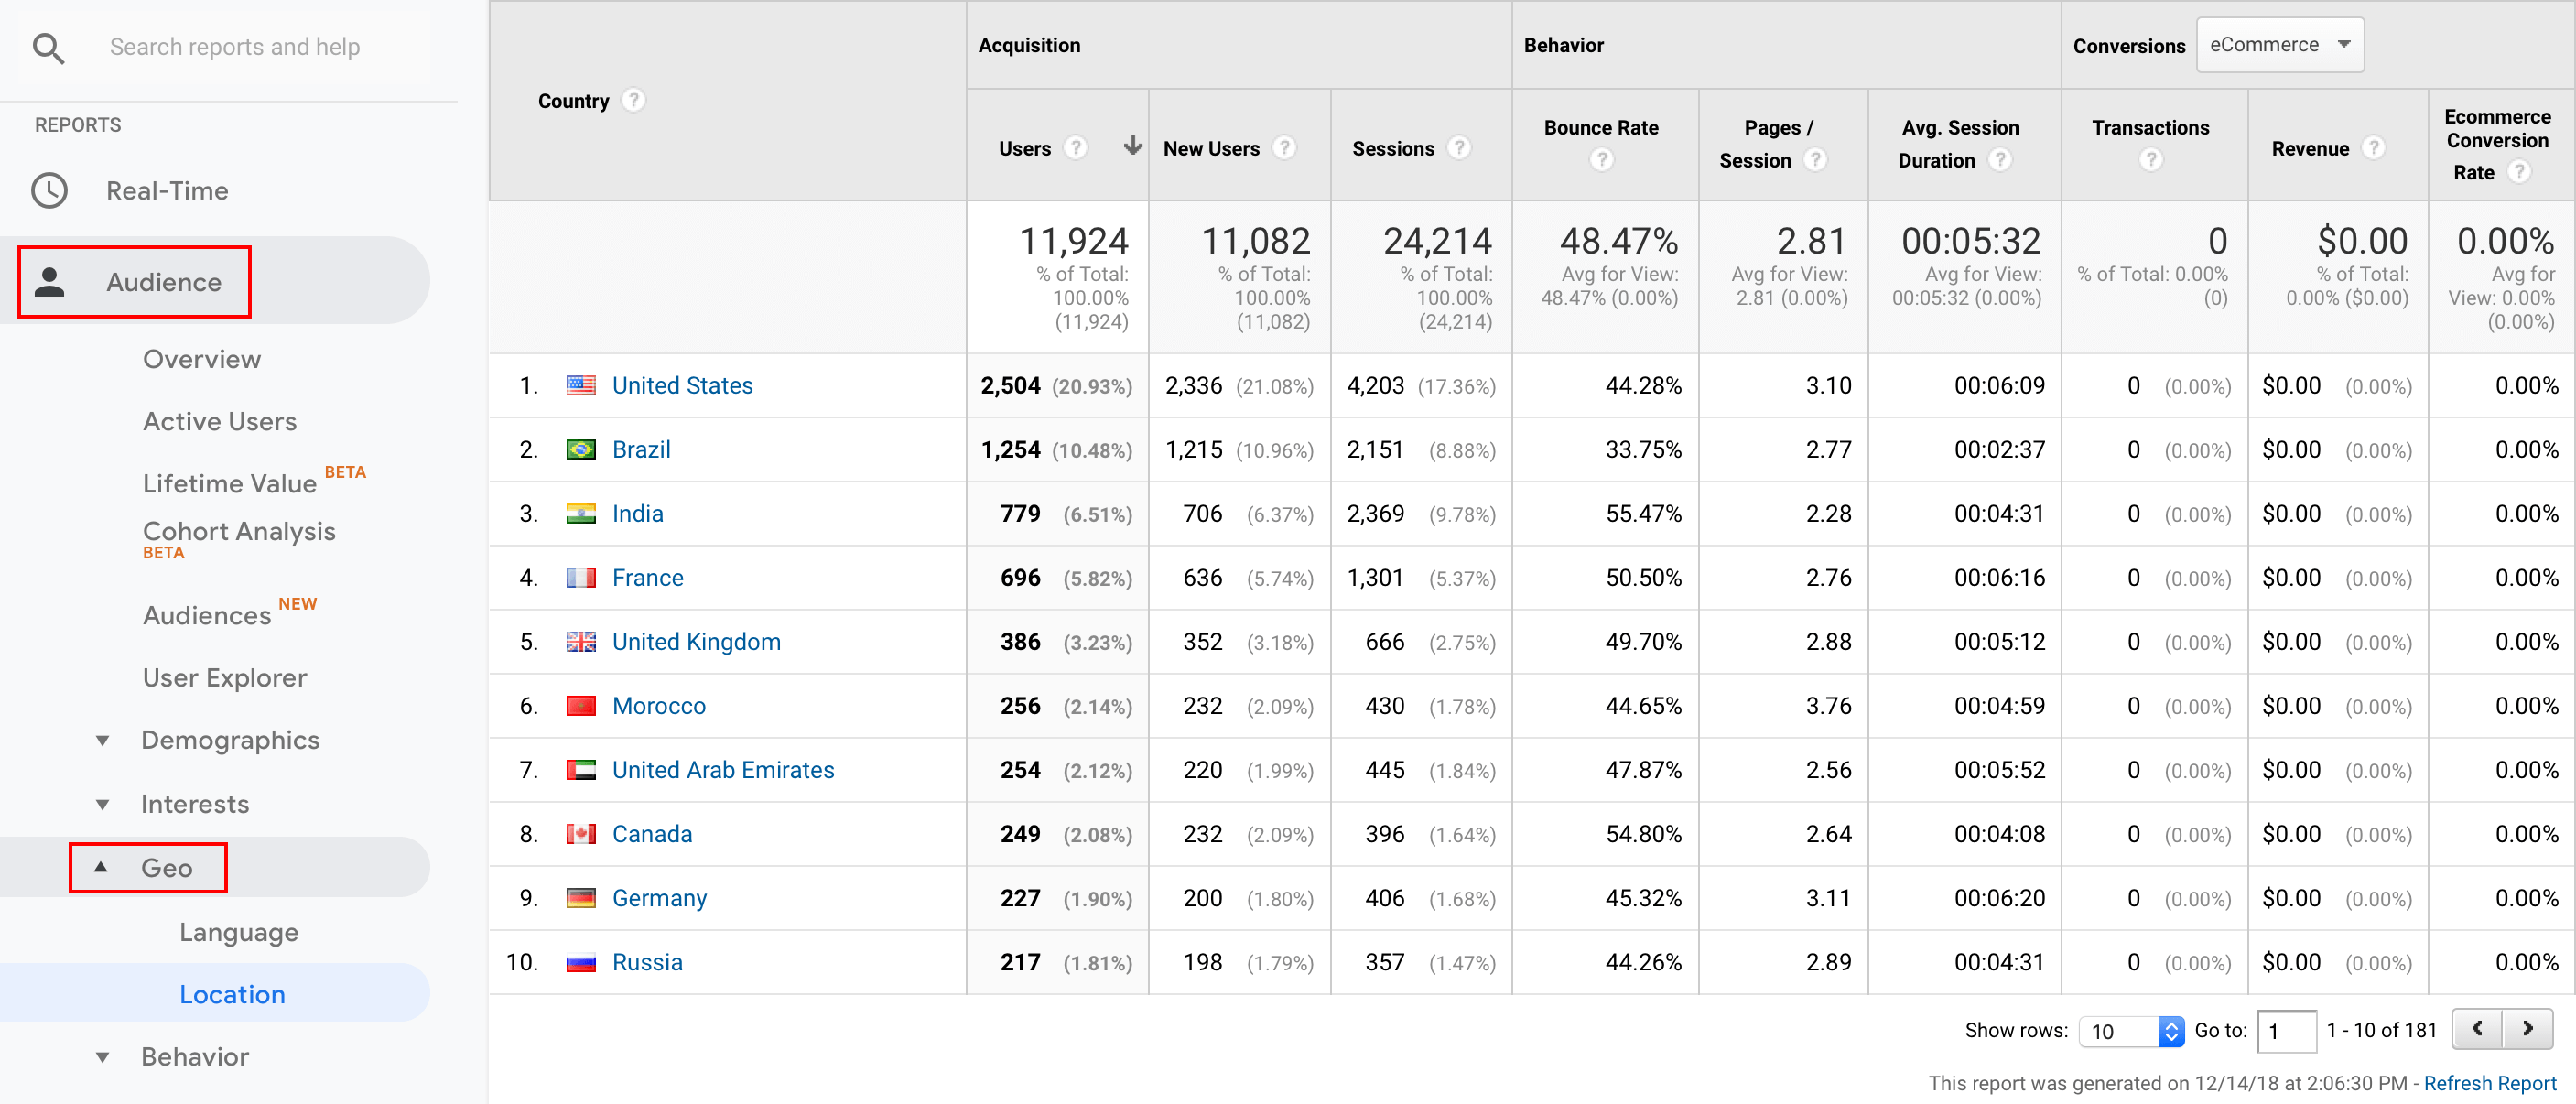
2. Geographical reports
Where are your customers from? Do you target the right locations in your campaigns? The “Geo” report shows countries, regions, states and cities from which your visitors are including the basic behavior metrics and conversions to see what is the potential of these visitors.
By adding a secondary dimension to the report, you will be able to see more detailed data such as sources, landing pages, or any other metric you are interested in.
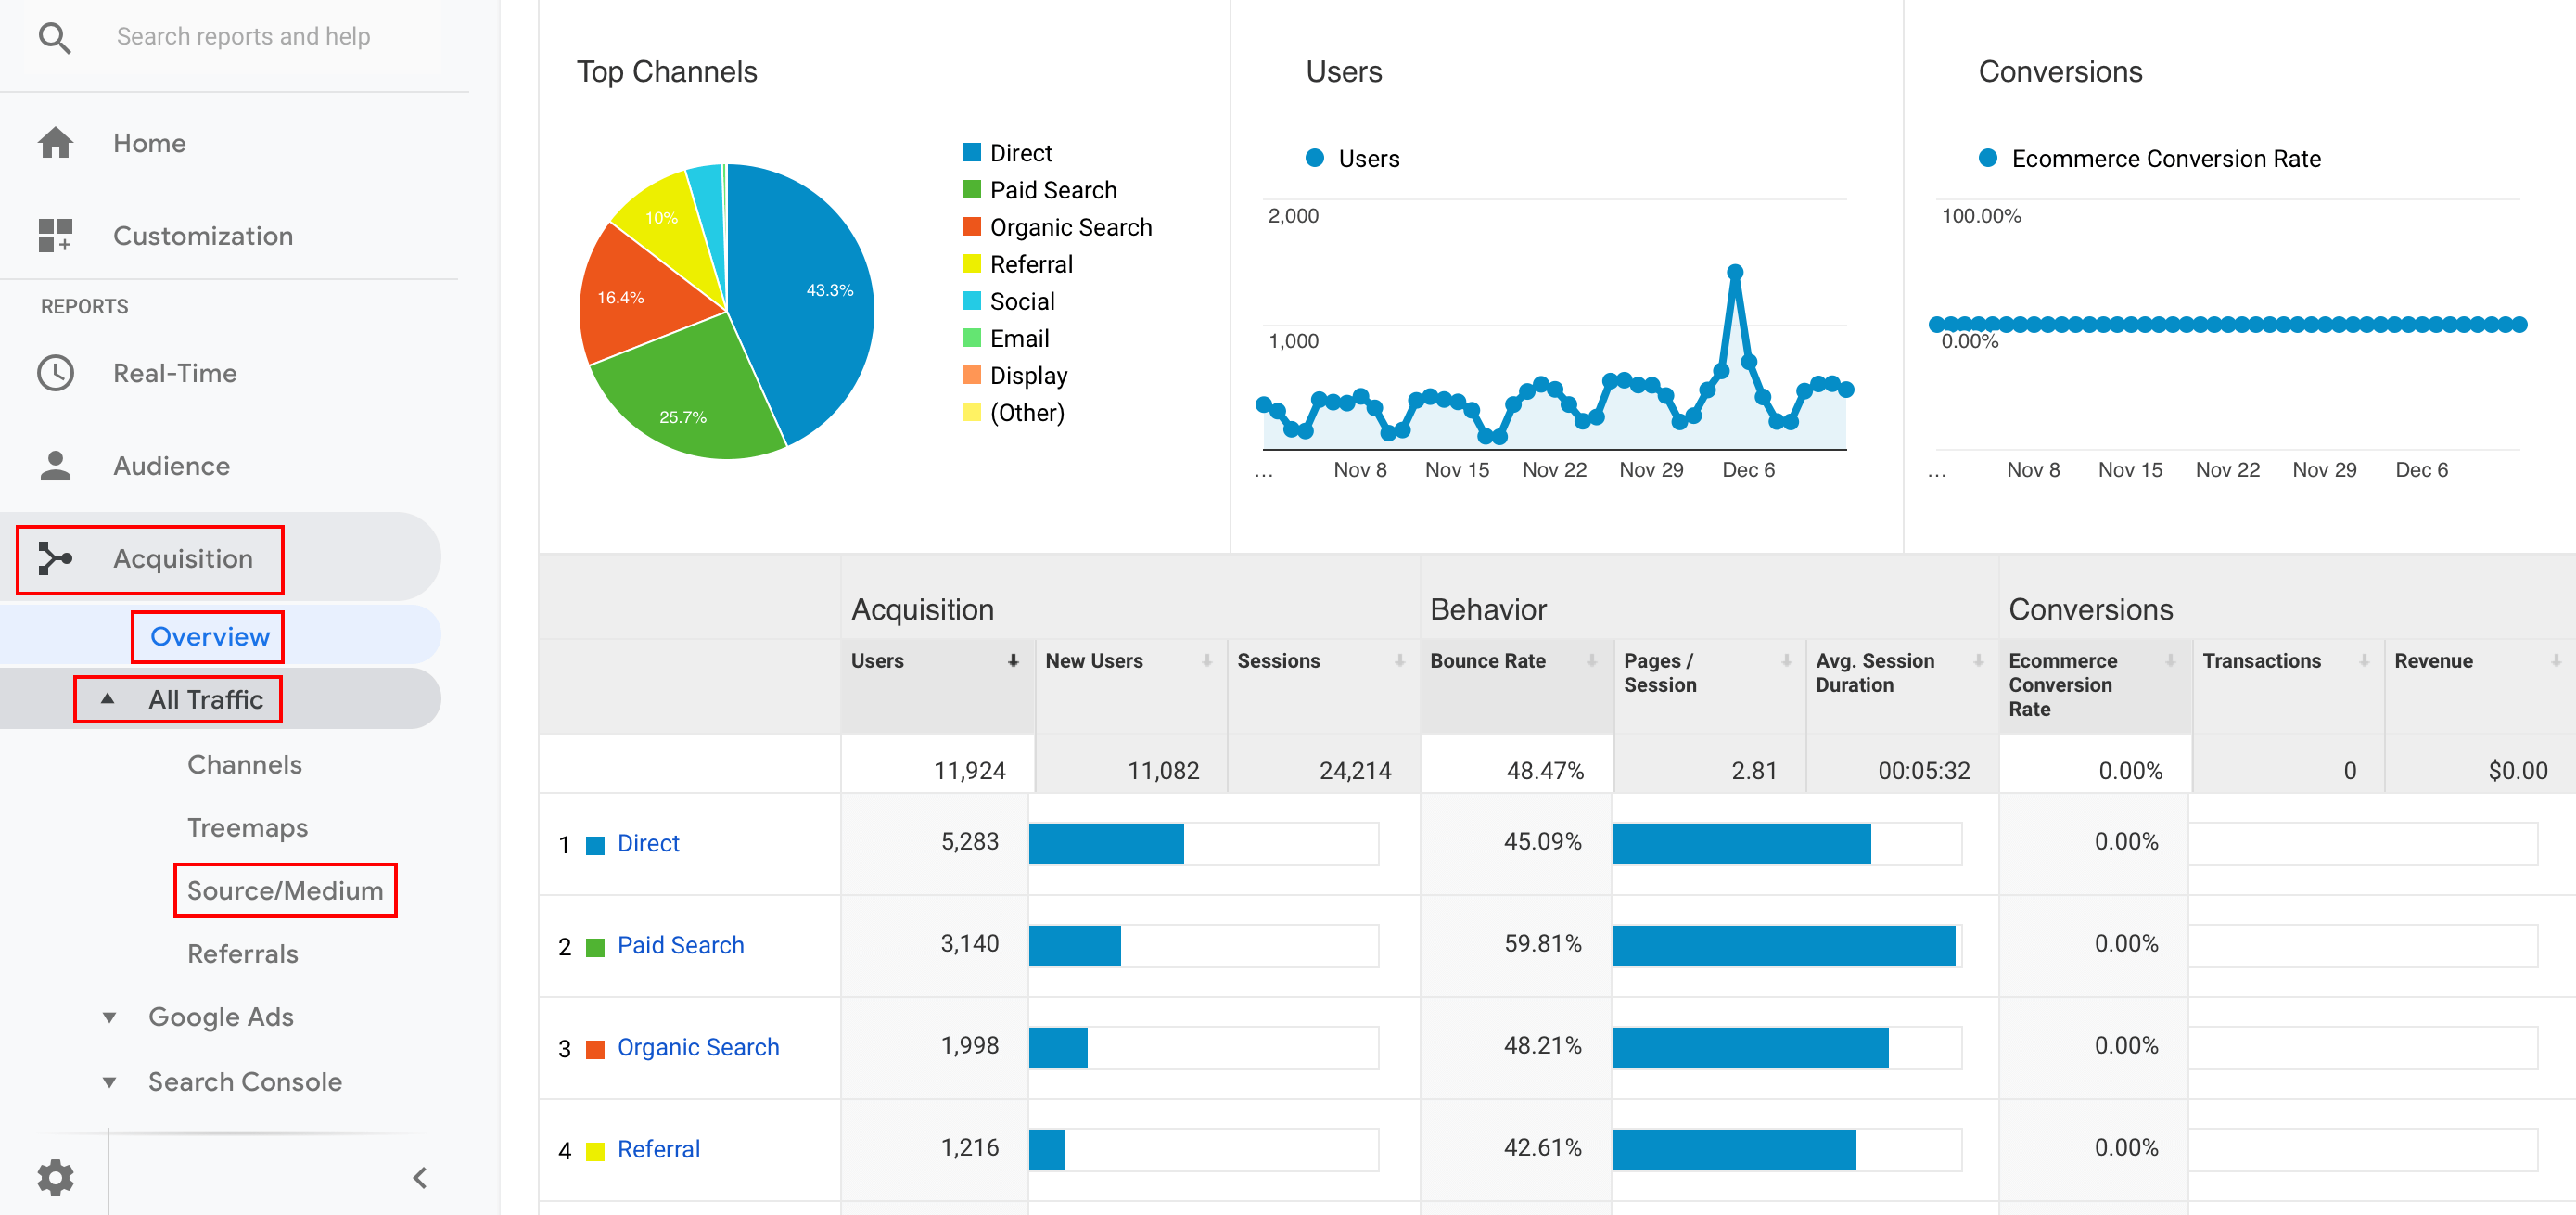
3. Sources of website traffic
The traffic acquisition is one of the most important reports in Google Analytics. It shows how you acquire the website visitors, i.e. whether they found you via organic search results, paid advertisement, your partner’s website, Facebook or any other source.
The Overview report groups these sources into channels as described in the screenshot below. To see detailed information about sources and the type of medium, go to “All traffic” and select “Source/medium”.
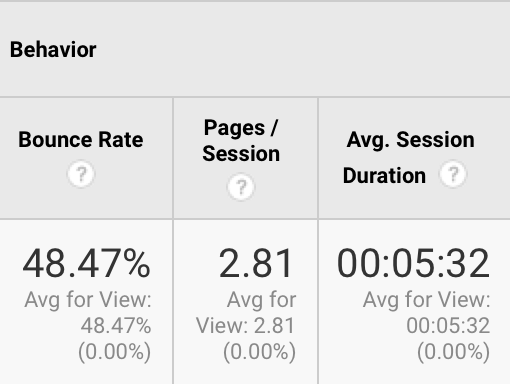
4. Engagement of your visitors
Find out why your visitors bounce or interact with your website. Google Analytics displays basic engagement metrics in almost every possible report so you don’t need to jump from one table to another.
Every time you analyze the traffic sources, locations, devices, locations, landing pages or other data, you can see how these people engaged with your website.
5. Conversion tracking
Running a business without tracking conversions is a road to hell. In Analytics, you can set up various types of conversions depending on your business type (signup forms, newsletter subscriptions, basket, purchase, etc.) and set their values.
When it comes to advanced features, you can link your product prices with Analytics via the E-Commerce feature.
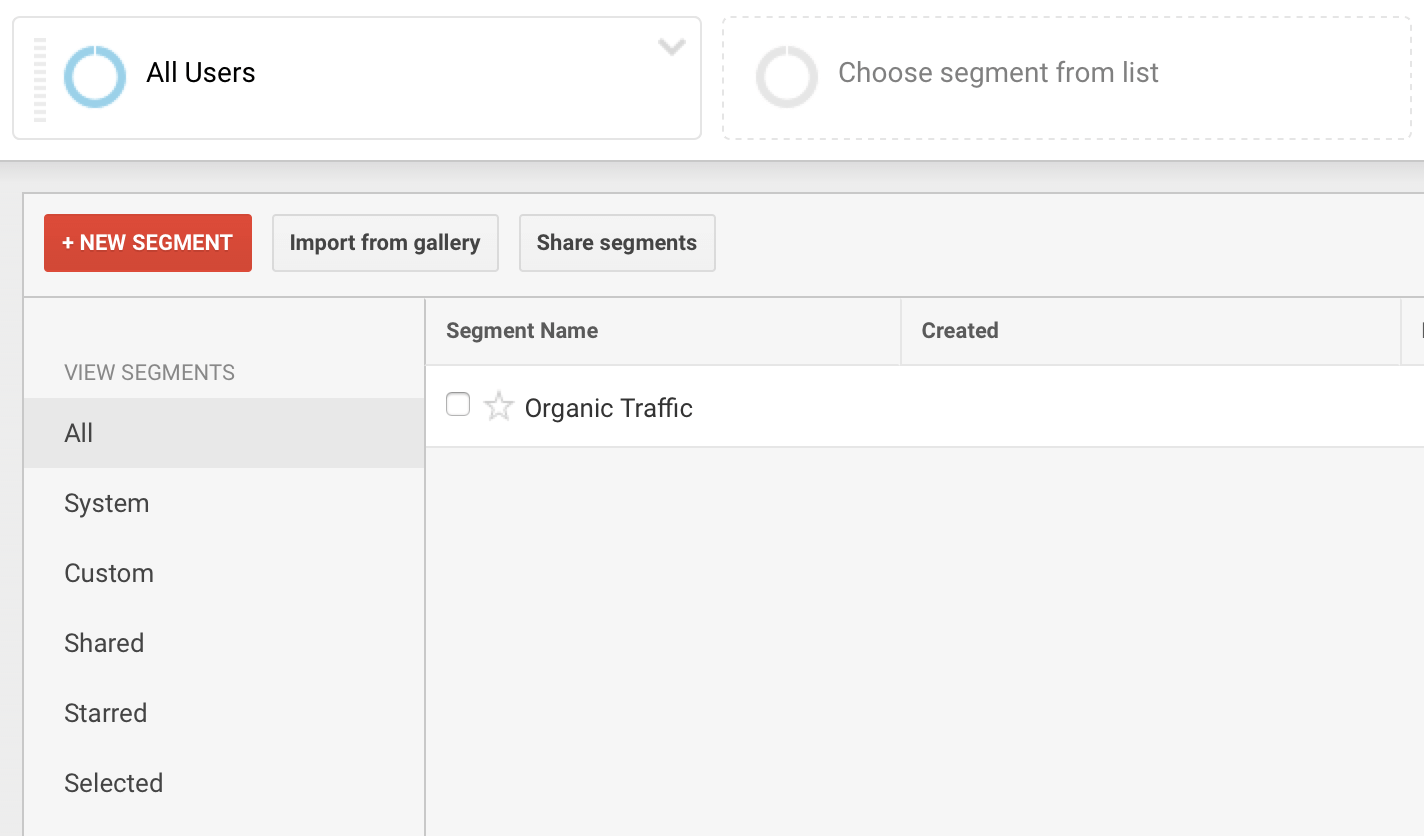
6. Organic traffic analysis
Increasing the organic traffic is one of the major goals for every website owner. It can be analyzed as part of reports, mainly in the “Acquisition” or by using a predefined “Organic Traffic” segment.
This way, you can see all reports based on organic traffic statistics.
7. Referral traffic analysis
Referral traffic reports tell you what number of traffic you earn from sources which mention your website. Google Analytics has two main options to see this data:
- The “Referrals” report in “Acquisition”
- The “Referral Traffic” predefined segment

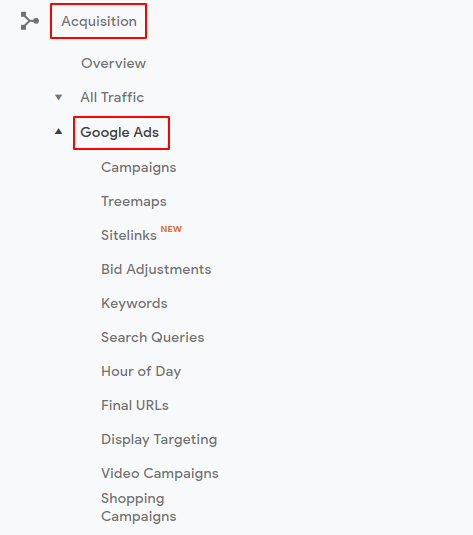
8. Paid traffic analysis
When it comes to Google Ads, the best source of reporting is the “Google Ads” tab under “Acquisition” with the breakdown of campaigns, keywords and many other useful data. To see proper numbers, you need to connect your Analytics with Google Ads.
The best way to track the performance of all other paid campaigns is to set correct UTM parameters and track them in the “Source/medium” or “Campaigns” reports.
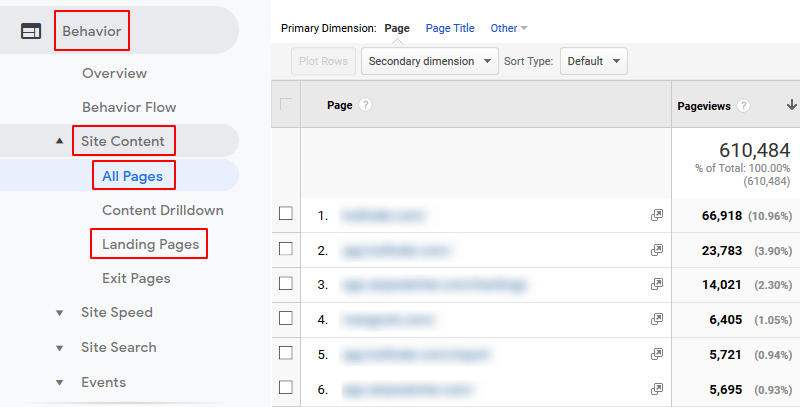
9. The most popular pages
What pages generate the most of your traffic? Another crucial report that will identify the most valuable content on your website. “All Pages” report is useful to see what pages are the ones with the highest traffic.
However, the “Landing Pages” report is more precise as it shows the performance of pages on which your website visitor landed at the beginning.
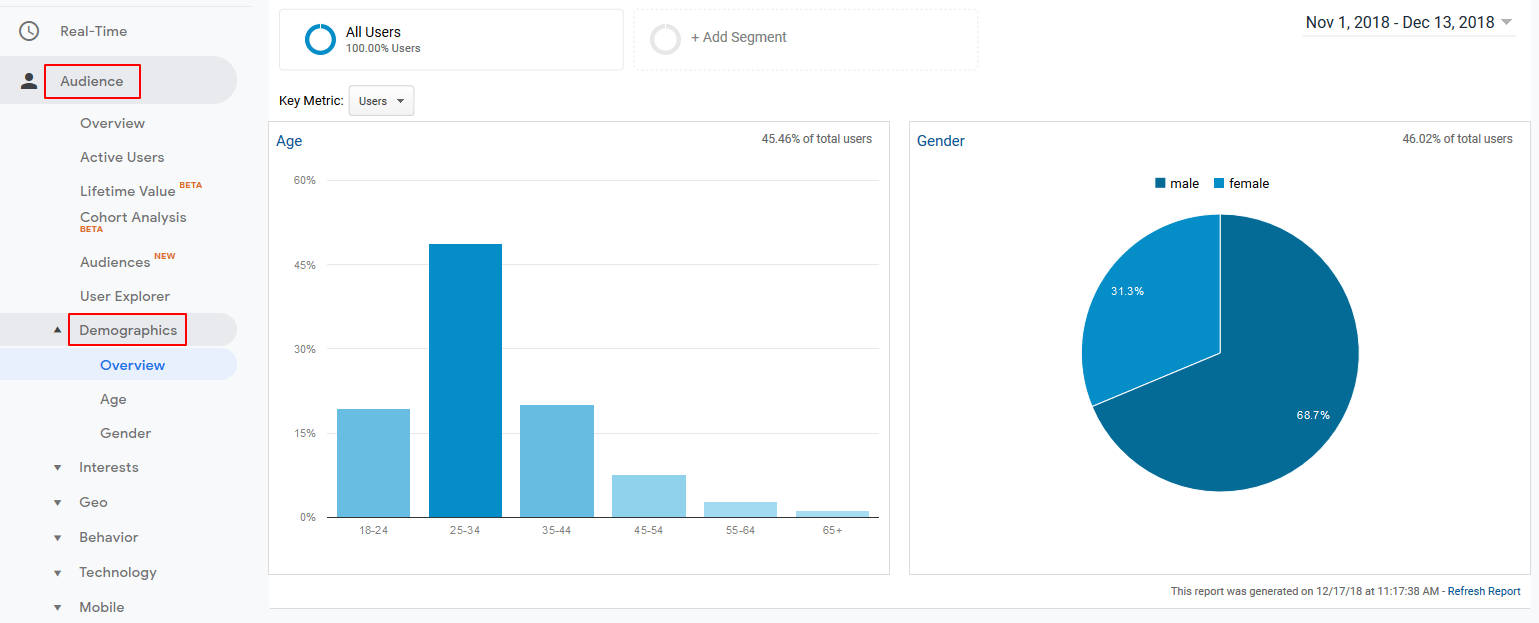
10. Demographics of your visitors
Knowing the demographics of your customers is another vital insight on which you can optimize the content, design, paid campaigns, word of mouth or even product itself.
The data is collected via logged users in Google Chrome. You’ll find the gender and age of your visitors in the “Demographics” tab under “Audience”. This section is full of other reports that will help you to identify who are your customers.
11. Historical data
Most of the data in Google Analytics will be loaded retrospectively right after you implement the tracking code on your website.
The best thing is that it allows you to compare the historical data to the current performance and get extremely important insights on how your website progresses in time.
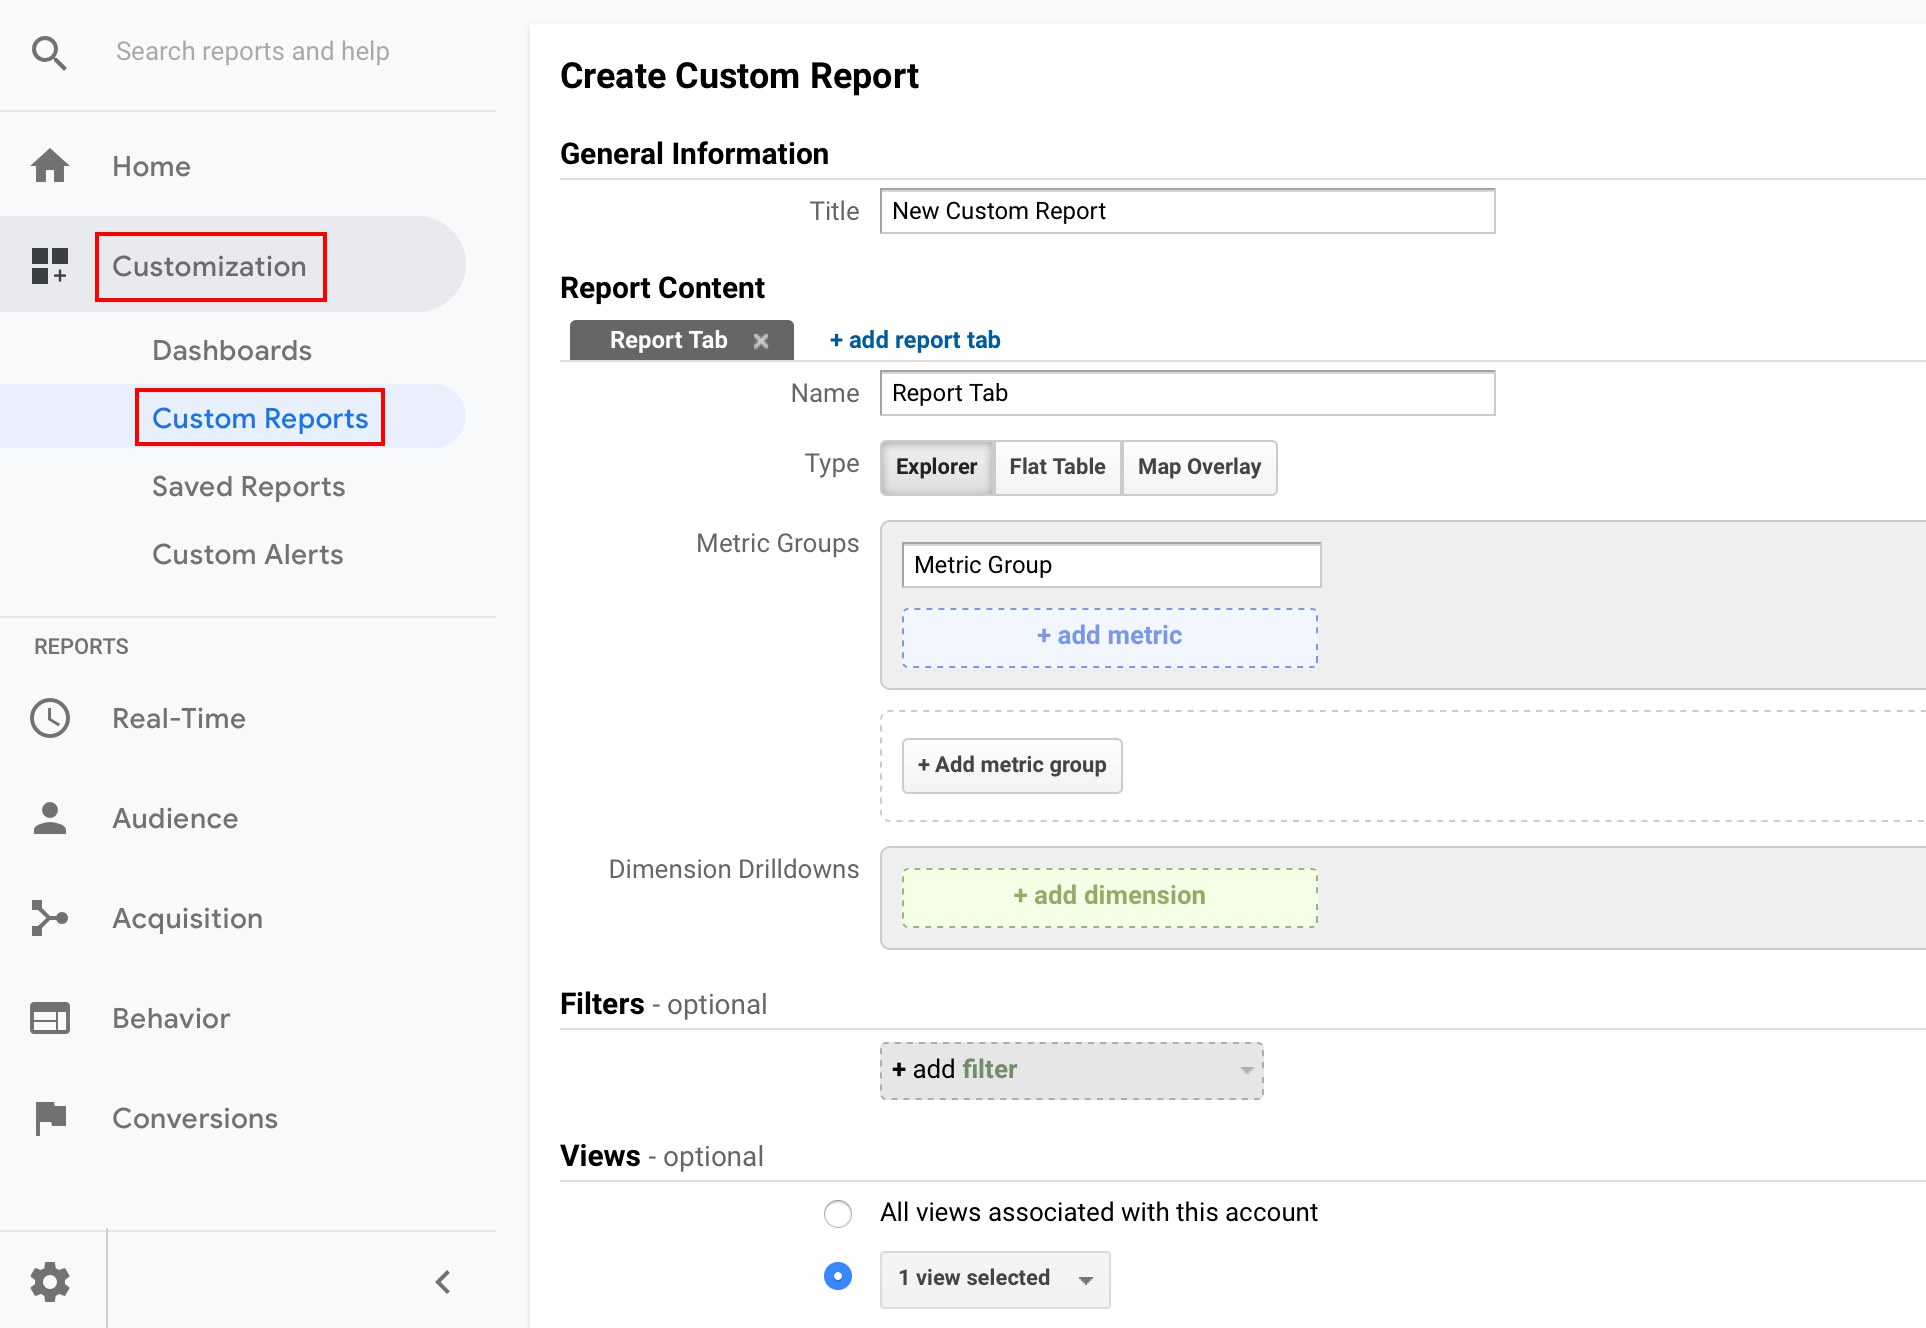
12. Custom reports and segments
To save a lot of time, you can easily create custom reports based on metrics and dimensions. The same things apply to custom segments.
Let’s say you want to see the behavior of users who were in the basket but haven’t finished the purchase. Creating a segment based on URL conditions will do the job for you.
How to set up Google Analytics
- Create a Google Analytics account
- Set up a property (your website or mobile app)
- Set up a reporting view
- Add tracking codes to your website or mobile app
Check the following video guide of the first steps:
Integrations with other Google tools
Google Analytics can be linked with all Google Marketing Platform tools so the data are shared across. Definitely start with Search Console and Google Ads.

