

A well-known idiom says – a picture paints a thousand words.
It is a great summary of why we can consider infographics as a very practical way of serving the information to the readers.
But what exactly makes an infographic more than just a pretty picture? It’s a visual handshake between information and imagination, a canvas where data dances with design, creating a visual narrative that’s both informative and intriguing.
From the sleek and straightforward to the elaborately elegant, infographics is the Swiss Army knife in your SEO toolkit.
In this comprehensive guide, we’ll peel back the layers of this visual phenomenon and take a look at:
- What is an infographic?
- How do infographics help SEO?
- How to prepare and optimize an infographic?
- Top 20 SEO infographics
Ready to embark on this journey of turning complex data into captivating visuals? Let’s get going!
What is an infographic?
An infographic is a visual representation of information, data, or knowledge (e.g. a chart or diagram) that can explain a topic or trend in an easy-to-understand way.
In the SEO world, infographics can bring you more organic traffic from Google Search, improve the user’s engagement on the website, and help you get more exposure online.
Types of infographics
You’ve likely seen thousands of infographics during your scrolling or research sessions, in emails and newsletters, and even in person.
But did you know that there are many types of infographics, each with its own set of unspoken ‘rules’?
Here are some of the most common infographic types you’ll run across:
- Statistical infographics – They focus on data visualization and often include charts, graphs, and numbers – ideal for presenting survey results or important statistics.
- Informational infographics – This type is used primarily for educational purposes and combines illustrations with text to explain a concept or process. They can take on many forms and are extremely versatile.
- Timeline Infographics – Visualize a timeline of events or the history of a topic. These are great for telling stories over time or explaining the steps in a process.
- Process Infographics – Sometimes graphics are the best way to explain how to do something. Process infographics outline a process or workflow, providing a step-by-step guide.
- Geographic Infographics: Here you can present data related to geographical locations, such as maps with overlaid information. This format is most useful for demographic data, location-based surveys, or travel guides.
- Comparison Infographics – Comparison infographics are great for comparing and contrasting options, ideas, or plans. They often include tables, Venn diagrams, or pros and cons lists.
- Hierarchical Infographics – These are used to display information in a hierarchical structure, such as organizational charts or family trees.
- List Infographics – Images like these are made for summarizing information in a list format, often used for tips, checklists, or rankings.
- Flowchart Infographics – Similar to a process infographic, flowcharts are for depicting decision-making processes or workflows with multiple paths and outcomes.
- Mixed Charts Infographics – Need to display a lot of data, but 5 bar graphs just don’t look good? Mixed charts infographics combine different types of data visualizations, such as pie charts, bar graphs, and line charts, within a single infographic.
How do infographics help SEO?
So you’ve been wowed by our examples above, but are infographics actually worth the trouble?
Absolutely!
Here’s how infographics can help your SEO efforts:
a) Increased organic traffic
Infographics can boost organic traffic by making content more engaging and shareable.
They can simplify complex topics, making your website more appealing to visitors and encouraging longer stays, which positively impacts SEO.
But talk is cheap, look at these stats:
- Posts with images have a 650% higher engagement rate.
- Over a one-year period, infographic posts were shown to receive 35.1% more traffic.
- 45% of Internet scrollers will click on a link if they see an infographic in it.
b) Improved link building
A well-designed infographic is likely to be shared and linked back to your site from other websites.
Why?
People love infographics; it’s as simple as that. These backlinks can significantly boost your site’s domain authority and improve search engine rankings … or in other words:
- 53% of markets implement infographics into their backlink strategies.
- Articles and blogs with infographics get 178% more inbound links than those that don’t.
c) Better user experience
Infographics improve user experience by presenting information in an easily digestible format, sometimes with pretty pictures, too!
A good user experience, signified by longer dwell times and lower bounce rates, can positively influence your SEO:
- Using infographics increases the drive to read by 80%.
- 55% of readers are more likely to accept a colored message than a black-and-white one.
d) Easy to share
Infographics are highly shareable, especially on social media platforms.
This sharing leads to increased visibility and traffic, indirectly boosting your SEO efforts. They also have a likelihood of going viral.
- Infographics are shared and liked 3x as often as other posts on social media.
- Infographics are 30x more likely to be read than text-only articles.
With stats like these, we bet you’re ready to start making your own and boosting your SEO!
How to prepare and optimize an infographic?
The process of creating an infographic can vary depending on your industry, but these simple steps should help you prepare the next infographic sensation:
- Identify the purpose: Start by defining the goal of your infographic. Is it to educate, inform, or persuade?
- Gather and organize data: Collect the necessary data and information. Organize it in a logical flow.
- Choose the right type of infographic: Based on your data and purpose, select the most appropriate infographic style.
- Design the infographic: Use design tools or collaborate with a designer. Focus on a clean layout, readable fonts, and appropriate colors.
- Incorporate visual elements: Use charts, icons, images, and graphs to visually represent your information.
- Add text: Include necessary text but keep it concise. Use bullet points or short paragraphs.
- Proofread and edit: Check for accuracy, clarity, and typos.
- Add branding: Include your logo and website URL.
When it comes to SEO however, there are a few extra steps that you should follow in order to make your infographics actually rank in Google Search or Google Images.
Optimize alt text and image file name
Make sure that your infographic’s file name and alt text include the focus keyword.
This helps search engines understand and index the image content.
So, for example, if your focus keyword for the ranking page is “on-page SEO checklist”, make sure to make it part of the image alt text and the file name of the infographic as well.
Improve image quality and size
Large image files can slow down page load times, negatively impacting SEO.
Optimize your infographic for a balance between quality and file size.
Depending on the loading speed of your site, you can use either JPEG, PNG, or webP format.
Add a call-to-action
Include a clear Call-to-Action (CTA) in your infographic.
This can guide viewers to take the desired action, such as visiting a webpage or signing up for a newsletter.
Make the infographic appealing
An engaging and visually appealing infographic is more likely to be shared and linked to, enhancing its SEO value.
Use compelling visuals and colors aligned with your brand.
Top 20 SEO infographics
Looking for inspiration and SEO knowledge all wrapped into one?
Here are 20 handpicked SEO infographics that will definitely help you boost your presence in Google Search:
- SEO Periodic Table (Search Engine Land)
- Killer SEO Checklist (Capsicum Mediaworks)
- Focus Keyword Optimization Checklist (Mangools)
- Goldilocks SEO (Seobook)
- 12 SEO Trends That Can’t Be Ignored (SerpLogic)
- The Ultimate WordPress SEO Checklist (Semrush)
- The Local SEO customization (Moz)
- History of Google’s Algorithm Updates (HubSpot)
- How Tiered Link Building Works (Ahrefs)
- Perfect On-page SEO (iMPACT)
- Mobile Search Affects Voice Search (SEOreseller)
- The Content Marketing Funnel (WordStream)
- SEO Check List (Elliance)
- On-page SEO Checklist (Erik Emanuelli)
- Voice Search (SonicSEO)
- SEO: Steps to Success (Bigstar copywriting)
- A Brief History of SEO (Verge)
- SEO Content Guideline (Enabler Space)
- 32 Steps On Local SEO Success Roadmap (99medialab)
- Optimize Images For SEO in 10 Steps (DiGiTALICO)
1. SEO Periodic Table (Search Engine Land)
Ever wished SEO was as organized as a chemistry periodic table?
Well, here’s your wish come true!
This creative infographic made by SEJ arranges SEO ranking factors in a super fun and easy-to-understand way.
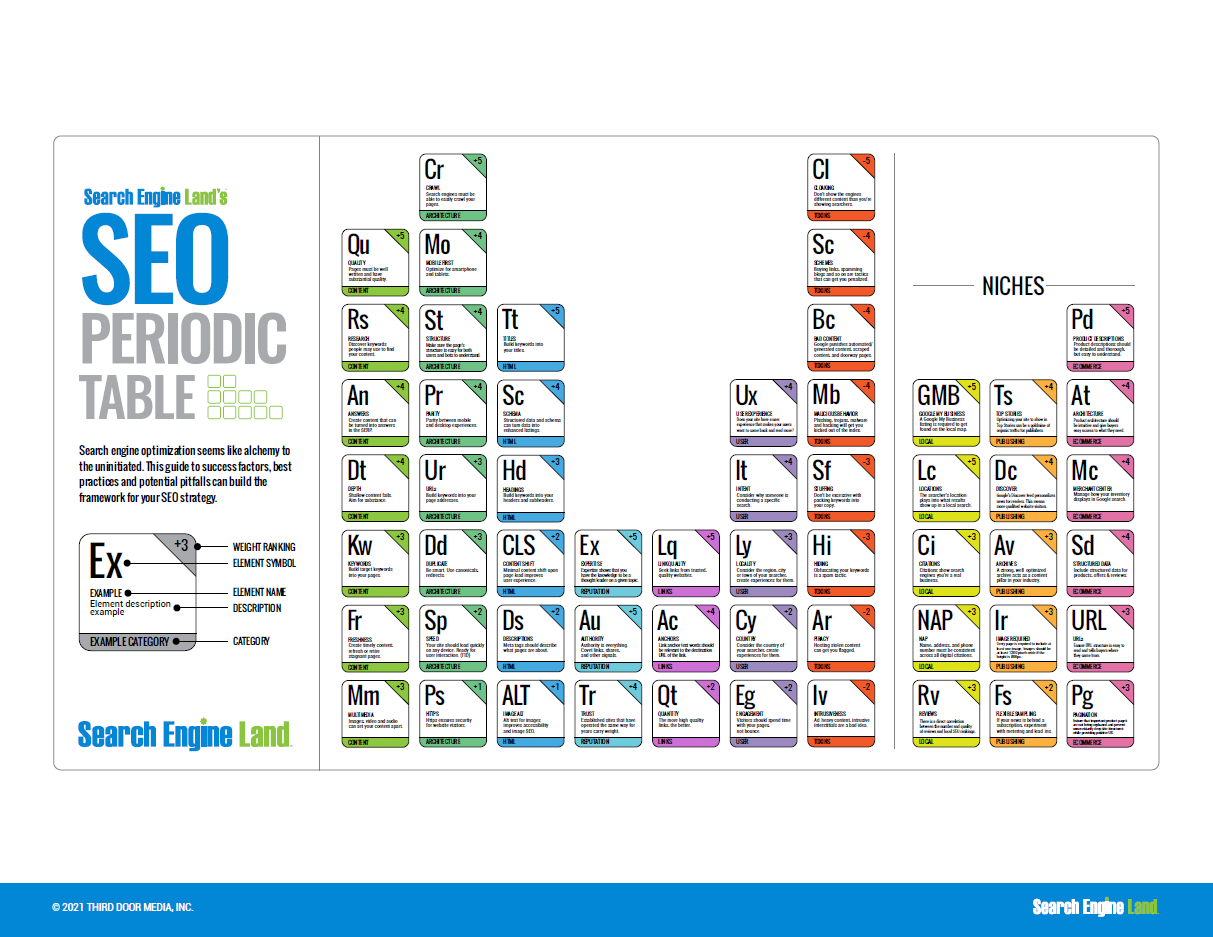
Source: Search Engine Land
2. Killer SEO Checklist (Capsicum Mediaworks)
This SEO checklist covers over 75 essential steps that need to be taken to have an SEO-friendly and SEO-successful website, both from the on-page and off-page point of view.
Killer SEO Checklist indeed!

Source: Capsicum Mediaworks
3. Focus Keyword Optimization Checklist (Mangools)
Of course, we LOVE creating our SEO infographics too!
With our simple focus keyword checklist, you will always remember how to properly optimize your website and where exactly to put your focus keyword on the page.
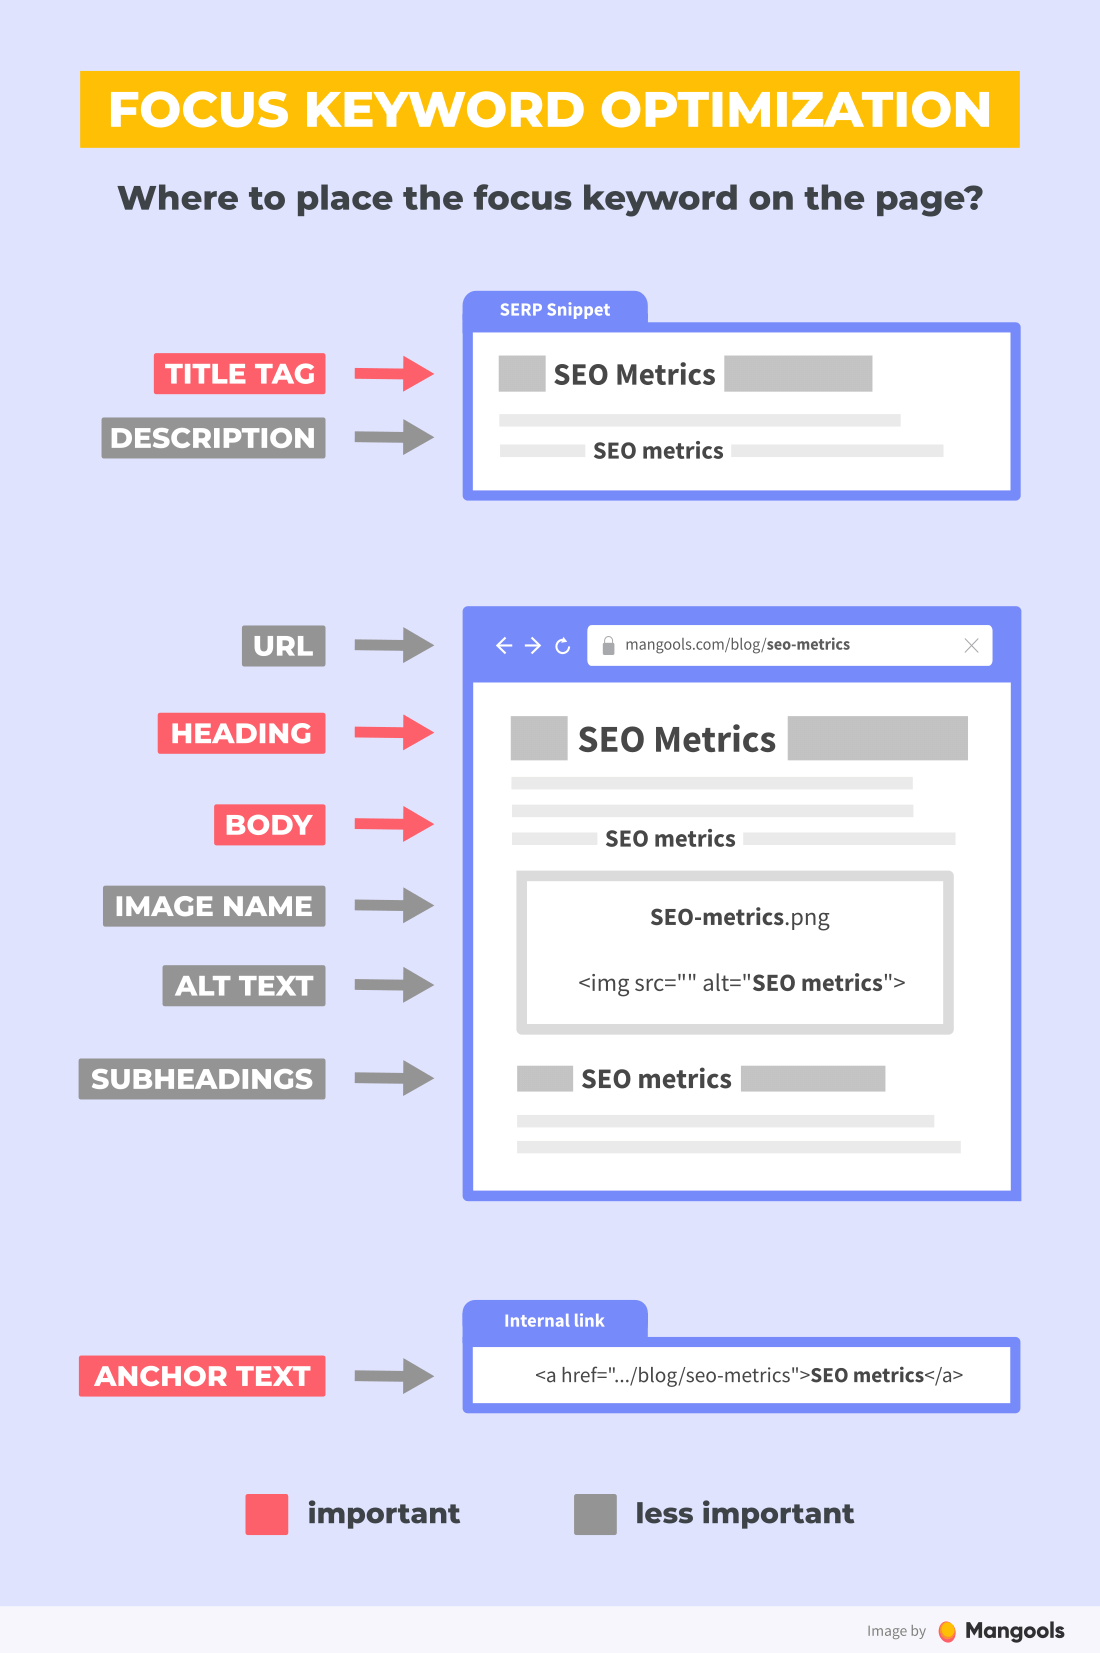
Source: Mangools
4. Goldilocks SEO (Seobook)
The Goldilocks principle – to use just the right amount of something – can be applied in many fields, including search engine optimization.
In this infographic, Seobook describes the most important aspects of today’s SEO and presents three stages of each: too hot – spammy, too cold – apathy, and just right – profitable.
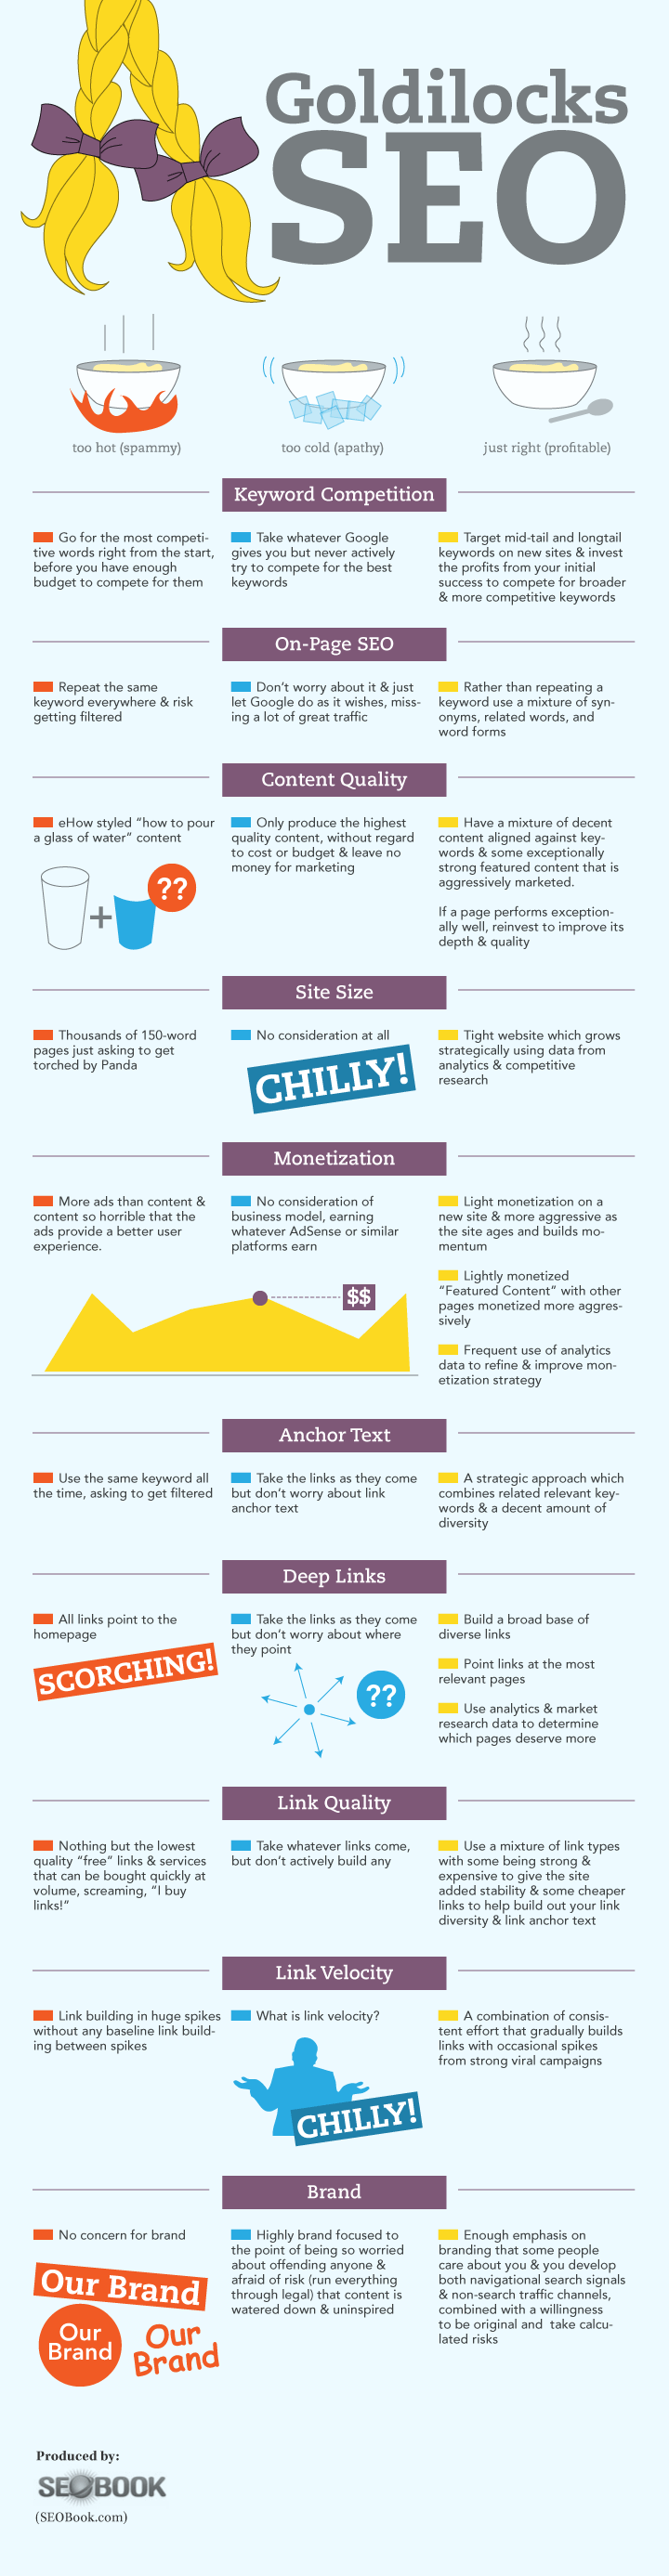
Source: Seobook
5. 12 SEO Trends That Can’t Be Ignored (SerpLogic)
Search engine algorithms are changing constantly.
Therefore, it is very important to stay sharp in the SEO field and have a good overview of the trends and possible future developments.
An infographic called 12 SEO trends that can’t be ignored will definitely help you in this.

Source: SerpLogic
6. The Ultimate WordPress SEO Checklist (Semrush)
Semrush is a great resource for SEO info and many helpful infographics like this one, which details what you should do from start to finish with WordPress.

Source: Semrush
7. The Local SEO customization (Moz)
Moz’s detailed local SEO guide helps readers tailor their local SEO to their business model type.
This makes the process of developing a strategy much easier for new businesses, with a fraction of the reading!

Source: Moz
8. History of Google’s Algorithm Updates (HubSpot)
Stay ahead of the game with this colorful infographic that walks you through the major updates of Google’s algorithm.
It’s like having a time machine for SEO!
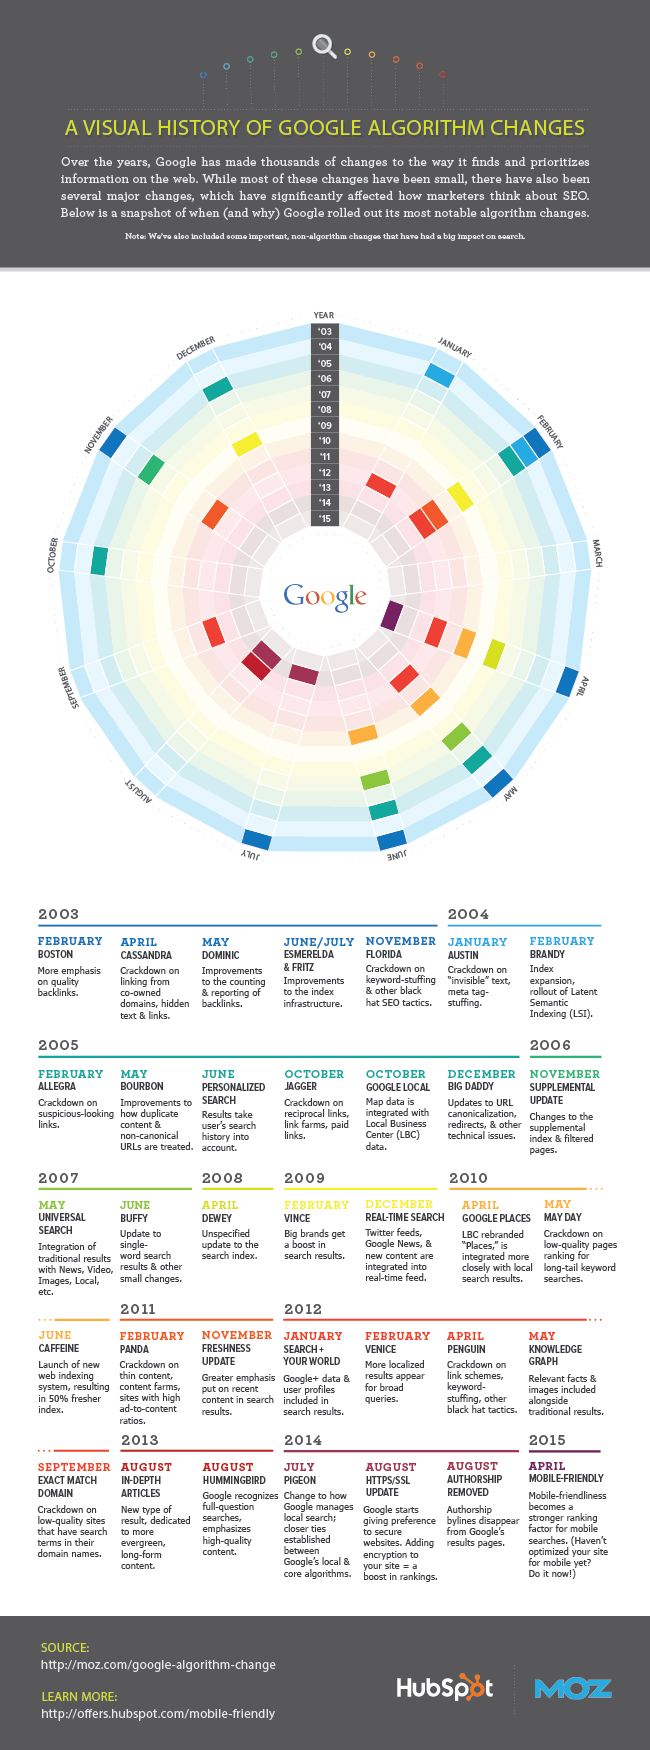
Source: Hubspot
9. How Tiered Link Building Works (Ahrefs)
For those of you who are curious about the mysteries of link building, this simple graphic gives a clear look into how tiered link building is structured.
Ahrefs, another SEO-based company, has more information and infographics on their link-building blog post.
Source: Ahrefs
10. Perfect On-page SEO (iMPACT)
Master the art of on-page SEO with this detailed breakdown from iMPACT.
It’s like having a blueprint for the perfect SEO-optimized page.
Source: iMPACT
11. Mobile Search Affects Voice Search (SEOreseller)
If you haven’t considered how mobile search can impact voice search, this infographic from SEO Reseller gives some great facts that might make you reconsider your strategy.
Source: SEOreseller
12. The Content Marketing Funnel (WordStream)
Learn how to navigate the content marketing funnel with this insightful infographic, which shows both your goals and the customer’s goals, as well as examples for each stage of the funnel.
Wordstream has more information, along with this infographic, available on their blog.
Source: WordStream
13. SEO Check List (Elliance)
For newly designed or updated websites, having a checklist for SEO is a good way to make sure you have all your ducks in a row.
Elliance has a good collection of infographics about marketing, SEO, and social media, so be sure to check them out!

Source: Elliance
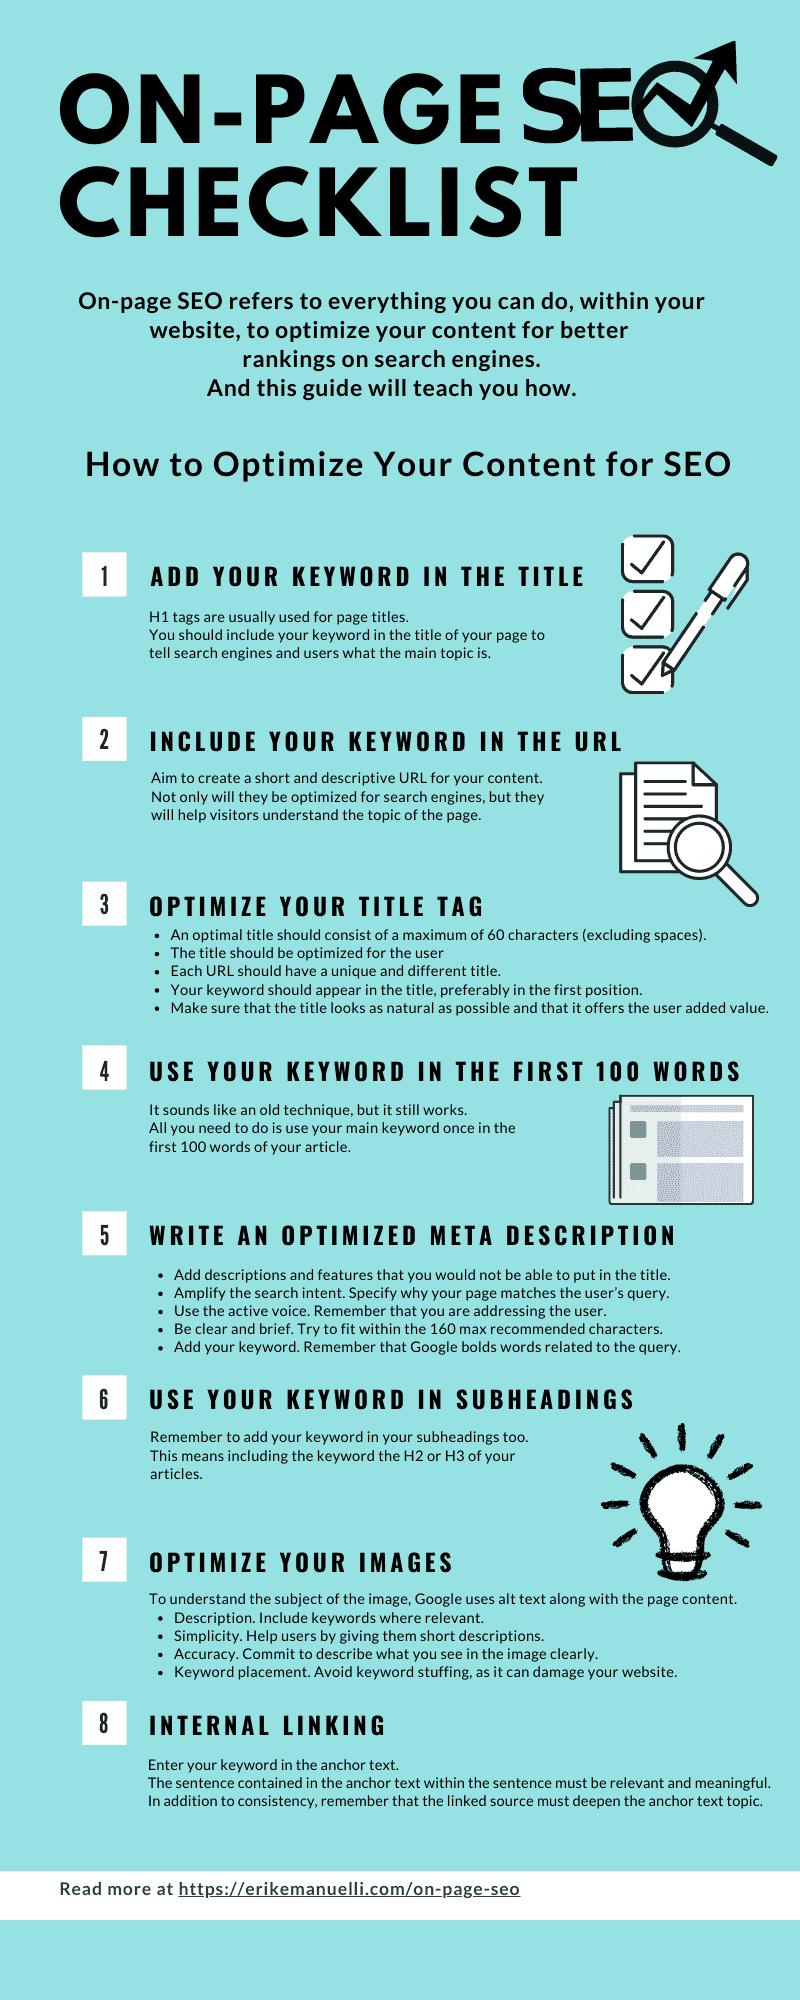
14. On-page SEO Checklist (Erik Emanuelli)
Do we at Mangools ever get tired of checklists?
No!
We think they’re the perfect way to ensure you never miss a thing when optimizing for SEO.
Erik Emanuelli’s on-page SEO checklist is a concise yet thorough list of what to do when you’re posting new content. Check it out!
15. Voice Search (SonicSEO)
Voice search is the future!
Get ahead of the curve with this infographic that explores the impact of voice search and how it’s growing.
You can find out more on Sonic SEO’s website.

Source: SonicSEO
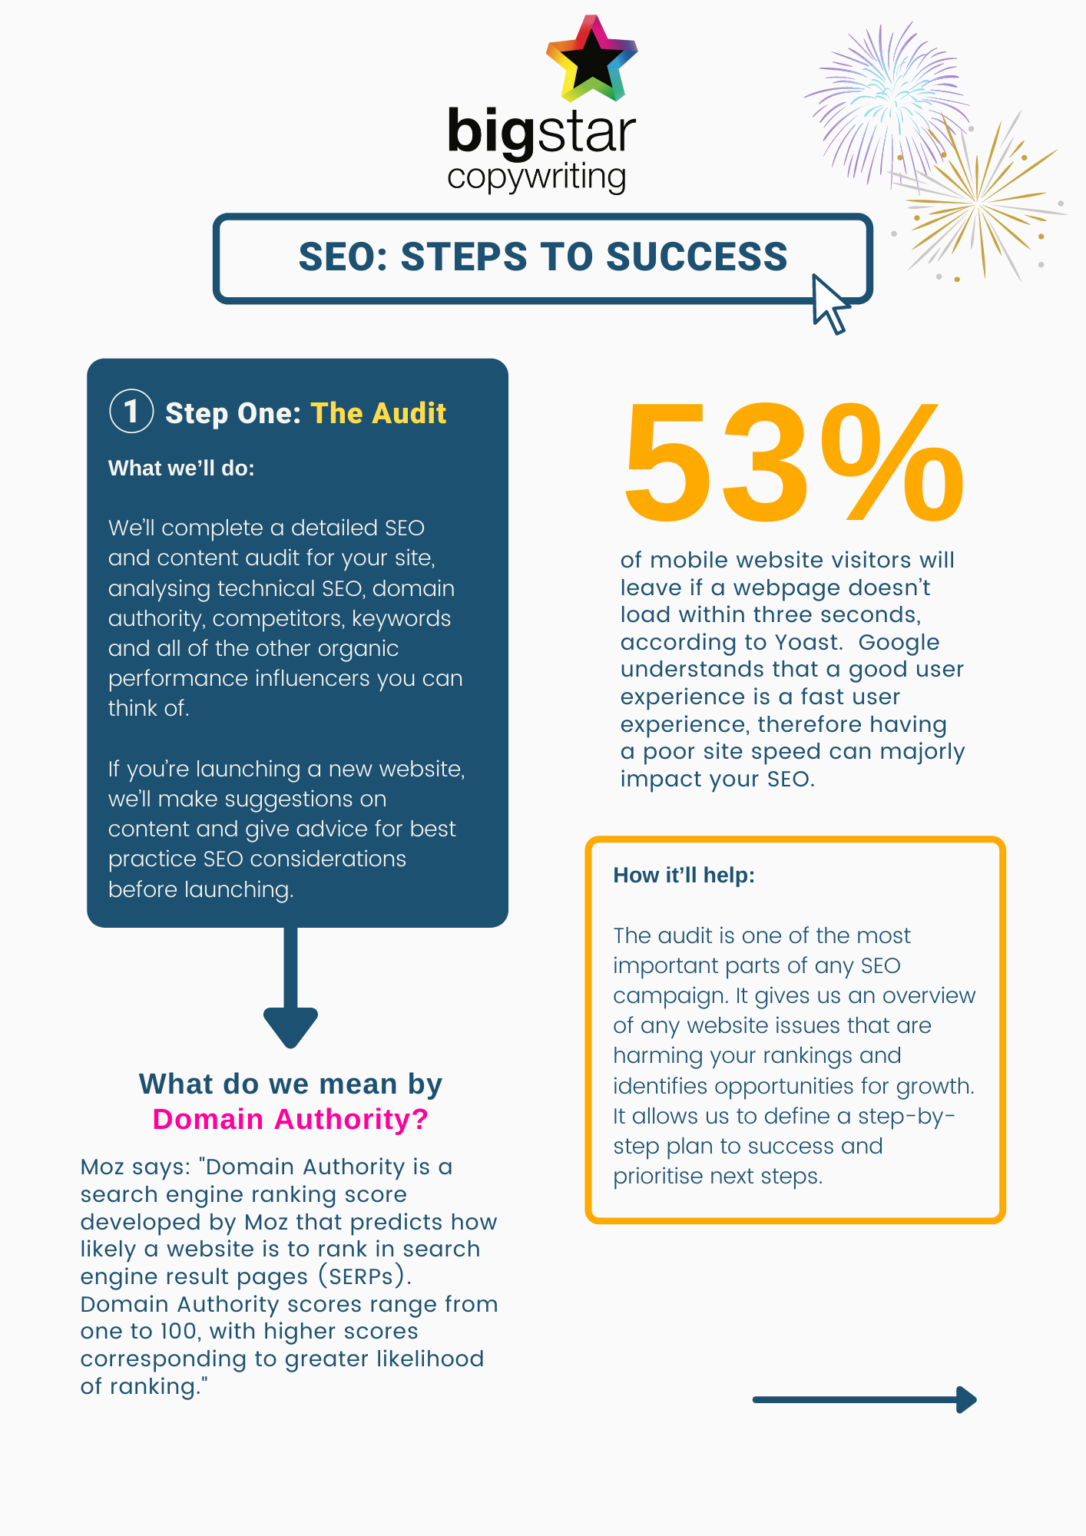
16. SEO: Steps to Success (Bigstar copywriting)
A little different is Big Star Copywriting’s infographic outlining their SEO services and how they’ll get your website into tip-top shape.
Alongside their process, there are also helpful facts and definitions.
This is a great way to share your business plan!
Source: Bigstar copywriting
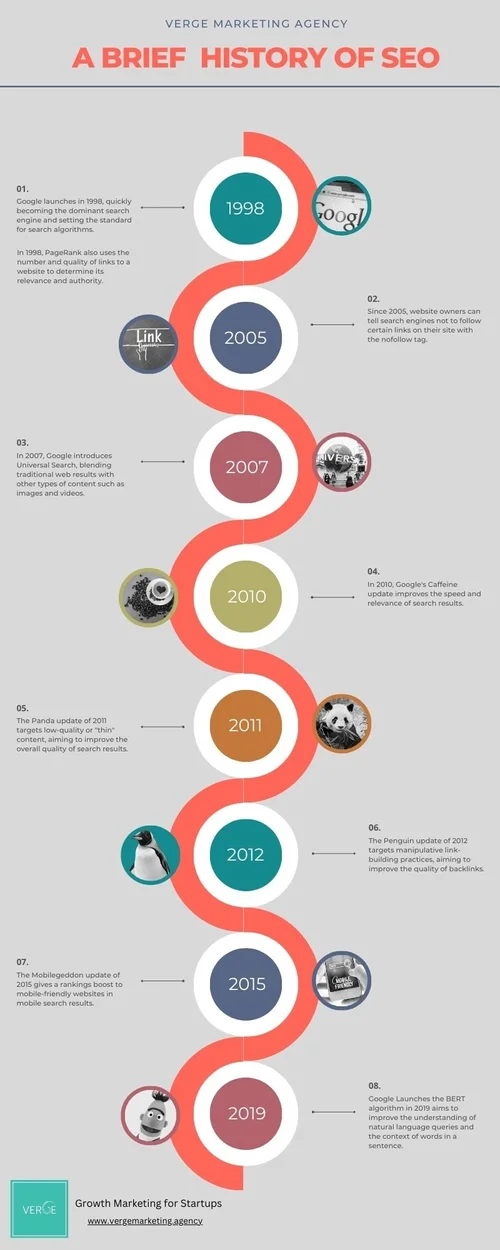
17. A Brief History of SEO (Verge)
SEO has evolved and changed a lot since its inception.
This infographic gives a good overview of the history of SEO with some interesting images.
Just check it out!
Source: Verge
18. SEO Content Guideline (Enabler Space)
A checklist with a slightly different format, Enabler Space’s guide to creating SEO content is a good framework for making and publishing content, separated into segments.
It’s a helpful guide that tells you the most important step in SEO.

Source: Enabler Space
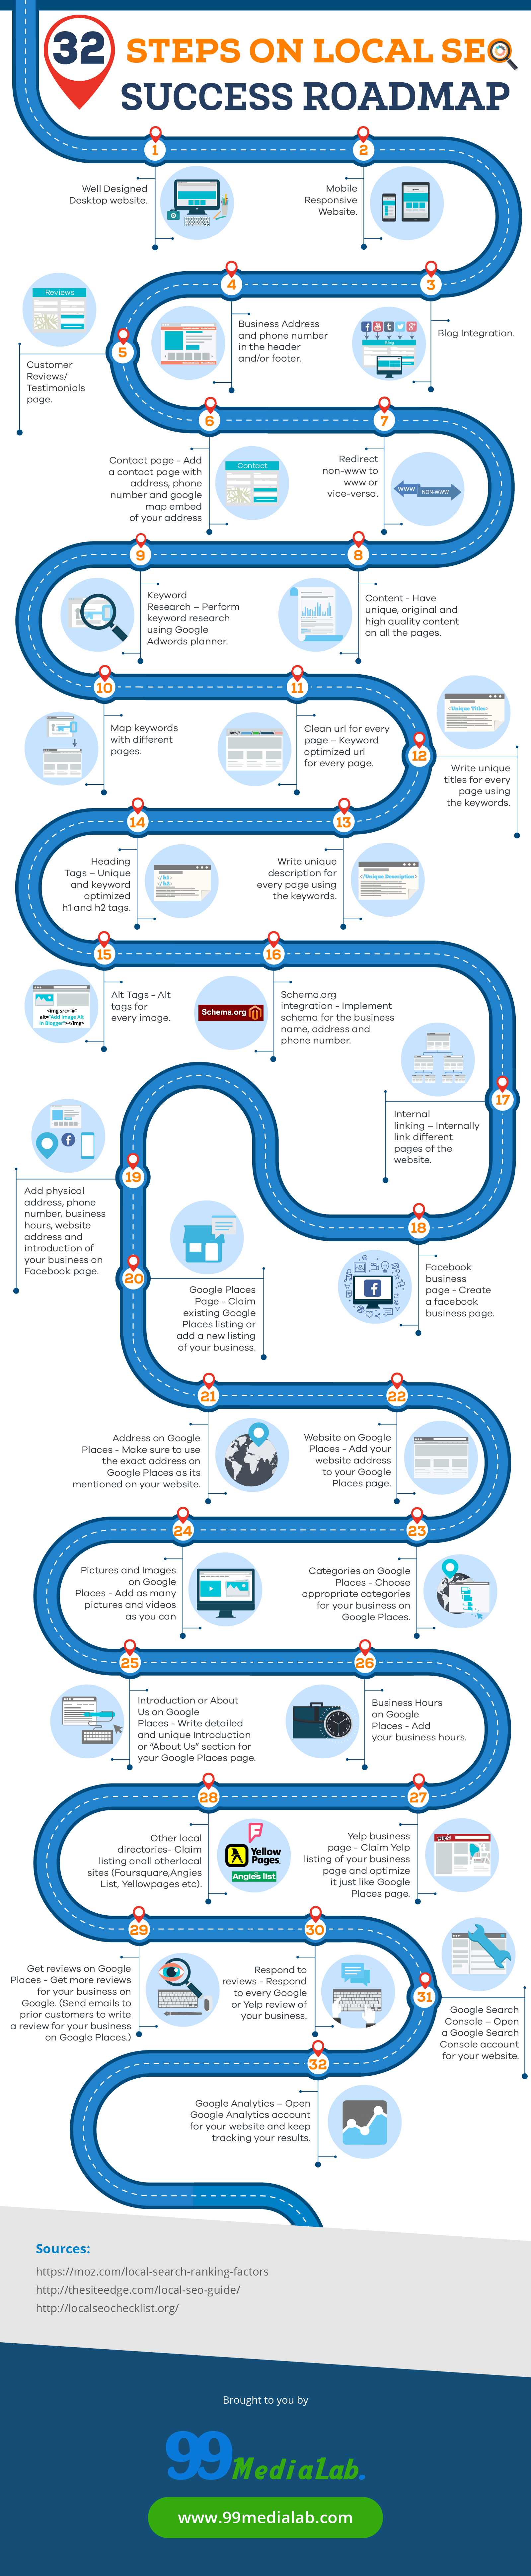
19. 32 Steps On Local SEO Success Roadmap (99medialab)
If you run a local business, there are certain SEO specifics that need to be taken into consideration.
You can follow this simple SEO checklist from the very beginning of the creation of the website, as it covers all the important stages of successful local SEO.
Source: 99medialab
20. Optimize Images For SEO in 10 Steps (DiGiTALICO)
Image optimization is an important (and often overlooked) part of on-page SEO.
A short but comprehensive infographic by Digitalico captured 10 steps of image SEO that should be always remembered.
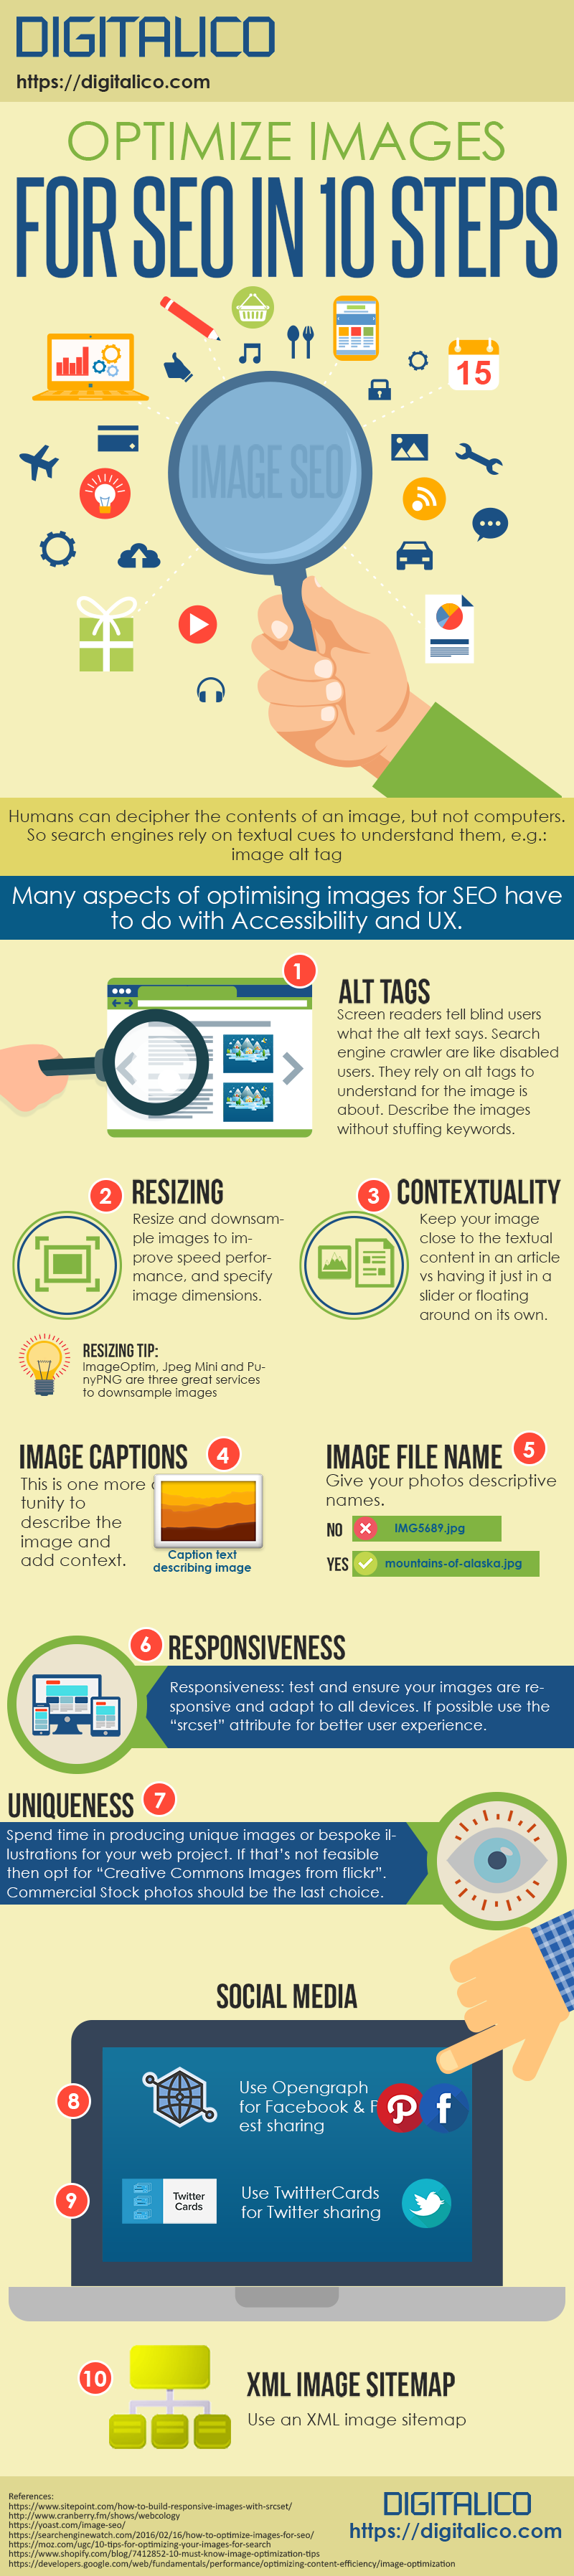
Source: DiGiTALICO
Conclusion
And there you have it – a whirlwind tour through the colorful and creative world of SEO infographics.
From the intricate dance of algorithms in Google’s updates to the dynamic strategies of content marketing, these visual masterpieces make the complex and sometimes daunting world of SEO accessible, engaging, and, dare we say, fun!
Infographics are more than just eye candy for your content strategy – they are powerful tools that can transform abstract SEO concepts into tangible insights.
From seasoned SEO gurus to those just dipping their toes into digital marketing waters, harnessing the power of infographics can elevate your content, engage your audience more deeply, and enhance your overall SEO performance.
So go ahead, explore these examples, draw inspiration, and maybe even create your own SEO infographic masterpiece.
The possibilities are as limitless as your creativity – and the next viral infographic could be just a concept away!
